
If you work for a big company, you may have a bunch of instances/databases under your control, you ran whatever monitoring tool has been provided and everybody is happy; But if your’re like me and you’re working for a big number of customers, each one with a different version of SQL and own configuration/security policies, with no monitoring tool directly available, and have to answer the question “what happened to the instance the other night” you may be a little bit overwhelmed.
That’s why I use the FirstResponderKit to analyze the status of the instances via these amazing stored procedures; sp_BlitzFirst can be scheduled to run at regular intervals in your server and in the meantime save to tables snapshots of waitstats, filestats and perfmon dmvs alongside with any relevant issue found in the time of the analysis, check the page here for more details on how to use this functionality.
You can do all of what will be described here and in the next article without using sp_BlitzFirst, but I find it useful regardless, tested and ready to go with a MIT license, it doesn’t get better than this.
Disclamer: All of this will be (hopefully) part of the next FirstRespoderKit release ready to go and packaged in the standard views
Let’s focus for a second on the Performance Counters because they need a bit of elaboration before being useful for analysis purposes.
How Performance Counters data is fetched
SELECT * FROM sys.dm_os_performance_counters
The idea is to get the data from the Performance Counters DMV and store it somewhere, sp_BlitzFirst already does this for you, (you can do it yourself, your call) and a few extra columns are stuffed in the results, like the server name and the snapshot date (checkdate).
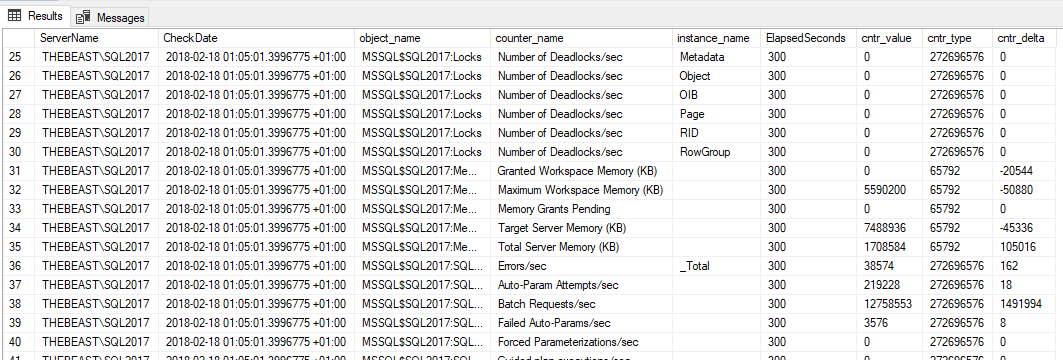
Then, a view (that I had the pleasure to rewrite recently) exists to compare the various runs one to the previous one:
SELECT TOP (1000) [ServerName]
      ,[CheckDate]
      ,[object_name]
      ,[counter_name]
      ,[instance_name]
      ,[ElapsedSeconds]
      ,[cntr_value]
      ,[cntr_type]
      ,[cntr_delta]
  FROM [dbo].[BlitzFirst_PerfmonStats_Deltas]
- [ElapsedSeconds] is the difference in seconds between the checkdate of this snapshot and the previous one
- [cntr_delta] is the difference in value [cntr_value] in this snapshot and the previous one
How to elaborate the values to get actual counters
The Value or the Delta value by itself is not enough to have a representation of the actual counter value, the trick is in the magic [cntr_type] column; Each counter belongs to a different counter type, that need to be evaluated in a different way.T
You can check this Microsoft article for the details that I’ll summarize here:
- Type 1073939712 : PERF_LARGE_RAW_BASE
- This counter value is raw data that is used as the denominator of a counter that presents a instantaneous arithmetic fraction
- i.e. the denominator to be used for the values of PERF_LARGE_RAW_FRACTION and PERF_AVERAGE_BULK
- Type 537003264: PERF_LARGE_RAW_FRACTION
- This counter value represents a fractional value as a ratio to its corresponding PERF_LARGE_RAW_BASE counter value.
- Type 1073874176: PERF_AVERAGE_BULK
- The value is cumulative, i.e. you have to take two snapshot at two different moments in time and the difference between those is the cumulate value between the checkdates.
- To get a meaningful value, the same must be done with the respective PERF_LARGE_RAW_BASE counter and divide the 1st delta by this one.
- Type 272696576: PERF_COUNTER_BULK_COUNT
- It is cumulative like PERF_AVERAGE_BULK, so to get an actual metric you need to get the delta between two checkdates, but to get a meaningful value you have to divide the delta by the number of elapsed seconds between the two checkdates.
- Type 65792: PERF_COUNTER_LARGE_RAWCOUNT
- This counter value shows the last observed value directly. Primarily used to track counts of objects.
Once you know this, create a view on the existing data is pretty easy, like this:
CREATE VIEW BlitzFirst_PerfMonStats_Actuals
AS
WITH PERF_AVERAGE_BULK AS
(
    SELECT ServerName,
           object_name,
           instance_name,
           counter_name,
           IIF(CHARINDEX('(', counter_name) = 0, counter_name, LEFT(counter_name, CHARINDEX('(', counter_name)-1)) AS counter_join,
           CheckDate,
           cntr_delta
    FROM   [dbo].[BlitzFirst_PerfmonStats_Deltas]
    WHERE  cntr_type IN(1073874176)
    AND cntr_delta <> 0
),
PERF_LARGE_RAW_BASE AS
(
    SELECT ServerName,
           object_name,
           instance_name,
           LEFT(counter_name, CHARINDEX('Base', counter_name)-1) AS counter_join,
           CheckDate,
           cntr_delta
    FROM   [dbo].[BlitzFirst_PerfmonStats_Deltas]
    WHERE  cntr_type IN(1073939712)
    AND cntr_delta <> 0
),
PERF_AVERAGE_FRACTION AS
(
    SELECT ServerName,
           object_name,
           instance_name,
           counter_name,
           counter_name AS counter_join,
           CheckDate,
           cntr_delta
    FROM   [dbo].[BlitzFirst_PerfmonStats_Deltas]
    WHERE  cntr_type IN(537003264)
    AND cntr_delta <> 0
),
PERF_COUNTER_BULK_COUNT AS
(
    SELECT ServerName,
           object_name,
           instance_name,
           counter_name,
           CheckDate,
           cntr_delta / ElapsedSeconds AS cntr_value
    FROM   [dbo].[BlitzFirst_PerfmonStats_Deltas]
    WHERE  cntr_type IN(272696576, 272696320)
    AND cntr_delta <> 0
),
PERF_COUNTER_RAWCOUNT AS
(
    SELECT ServerName,
           object_name,
           instance_name,
           counter_name,
           CheckDate,
           cntr_value
    FROM   [dbo].[BlitzFirst_PerfmonStats_Deltas]
    WHERE  cntr_type IN(65792, 65536)
)

SELECT NUM.ServerName,
       NUM.object_name,
       NUM.counter_name,
       NUM.instance_name,
       NUM.CheckDate,
       NUM.cntr_delta / DEN.cntr_delta AS cntr_value
FROM   PERF_AVERAGE_BULK AS NUM
       JOIN PERF_LARGE_RAW_BASE AS DEN ON NUM.counter_join = DEN.counter_join
                                          AND NUM.CheckDate = DEN.CheckDate
                                          AND NUM.ServerName = DEN.ServerName
                                          AND NUM.object_name = DEN.object_name
                                          AND NUM.instance_name = DEN.instance_name

UNION ALL

SELECT NUM.ServerName,
       NUM.object_name,
       NUM.counter_name,
       NUM.instance_name,
       NUM.CheckDate,
       TRY_CONVERT(DECIMAL(4,3),CAST(NUM.cntr_delta as DECIMAL(18,3)) / DEN.cntr_delta ) AS cntr_value
FROM   PERF_AVERAGE_FRACTION AS NUM
       JOIN PERF_LARGE_RAW_BASE AS DEN ON NUM.counter_join = DEN.counter_join
                                          AND NUM.CheckDate = DEN.CheckDate
                                          AND NUM.ServerName = DEN.ServerName
                                          AND NUM.object_name = DEN.object_name
                                          AND NUM.instance_name = DEN.instance_name
UNION ALL

SELECT ServerName,
       object_name,
       counter_name,
       instance_name,
       CheckDate,
       cntr_value
FROM   PERF_COUNTER_BULK_COUNT

UNION ALL

SELECT ServerName,
       object_name,
       counter_name,
       instance_name,
       CheckDate,
       cntr_value
FROM   PERF_COUNTER_RAWCOUNT
This view should contain meaningful values for the counters, and can be used in our PowerBI report, in the next part!