The other day I was reading about spinlocks and troubleshooting and it mentioned to get the callstack for a certain xevent and to decode it using the windows debugging symbols, however, that material was related to SQL Server 2012 and the steps weren’t basically replicabile for a modern version like SQL 2016/2017 (or even 2014 I think, but haven’tn checked personally), I searched around and didn’t really find something straight forward for just the process as it is now: So, here we are, small guide on how to get and decode callstacks in recent versions of SQL Server.
Xevent SetUp – Get the callstack
In my case, I wanted to read the callstack (i.e. the last 16 frames inside the SQLServer process) when a SOS_SCHEDULER_YIELD wait event occurred, there was no practical reason, just to see how things work, as callstacks are needed only in very edge cases scenarios for serious troubleshooting.
I created the following event:
CREATE EVENT SESSION [WaitCalllstack] ON SERVER
ADD EVENT sqlos.wait_info(
    ACTION(package0.callstack)
    WHERE ([wait_type]=(123)))
ADD TARGET package0.ring_buffer
WITH (MAX_MEMORY=4096 KB,EVENT_RETENTION_MODE=ALLOW_SINGLE_EVENT_LOSS,MAX_DISPATCH_LATENCY=30 SECONDS,MAX_EVENT_SIZE=0 KB,MEMORY_PARTITION_MODE=NONE,TRACK_CAUSALITY=OFF,STARTUP_STATE=OFF)
GO

ALTER EVENT SESSION [WaitCallstack] ON SERVER
STATE = START;
GO
Of course I used the GUI because I’m lazy, but the code isn’t too bad either this time as we’re only acting on a sqlos.wait_info filtered by wait type = 123 (which is SOS_SCHEDULER_YIELD), getting the callstack and saving it to the ring buffer.
Launch the event, wait a couple of seconds and you’ll start to see the following in the ring buffer:
<event name="wait_info" package="sqlos" timestamp="2018-02-16T23:08:35.919Z">
  <data name="wait_type">
    <type name="wait_types" package="sqlos"></type>
    <value>123</value>
    <text><![CDATA[SOS_SCHEDULER_YIELD]]></text>
  </data>
  <data name="opcode">
    <type name="event_opcode" package="sqlos"></type>
    <value>1</value>
    <text><![CDATA[End]]></text>
  </data>
  <data name="duration">
    <type name="uint64" package="package0"></type>
    <value>0</value>
  </data>
  <data name="signal_duration">
    <type name="uint64" package="package0"></type>
    <value>0</value>
  </data>
  <data name="wait_resource">
    <type name="ptr" package="package0"></type>
    <value>0x0000000000000000</value>
  </data>
  <action name="callstack" package="package0">
    <type name="callstack" package="package0"></type>
    <value><![CDATA[sqldk.dll+0x0000000000105685
            sqldk.dll+0x0000000000002211
            sqldk.dll+0x0000000000001F3F
            sqldk.dll+0x0000000000011047
            sqldk.dll+0x0000000000010F3F
            sqldk.dll+0x000000000000AA59
            sqldk.dll+0x00000000000025BF
            sqldk.dll+0x0000000000007F64
            sqldk.dll+0x00000000000B36CF
            sqldk.dll+0x00000000000B087A
            sqldk.dll+0x00000000000B0054
            sqlservr.exe+0x0000000000012F5D
            sqldk.dll+0x0000000000004E7D
            sqldk.dll+0x0000000000005378
            sqldk.dll+0x0000000000004FED
            sqldk.dll+0x0000000000030C38
            sqldk.dll+0x0000000000030D30
            sqldk.dll+0x0000000000030857
            sqldk.dll+0x0000000000031049
            KERNEL32.DLL+0x0000000000011FE4
            ntdll.dll+0x000000000006EFC1]]>
     </value>
  </action>
</event>
Of course we’re interested in the callstack section of the XML output, which at the moment is pretty much useless as far as understanding what’s going on goes; So, next step, decode it.
Getting the right symbols
Decoding the callstack has actually gotten easier than the old days.
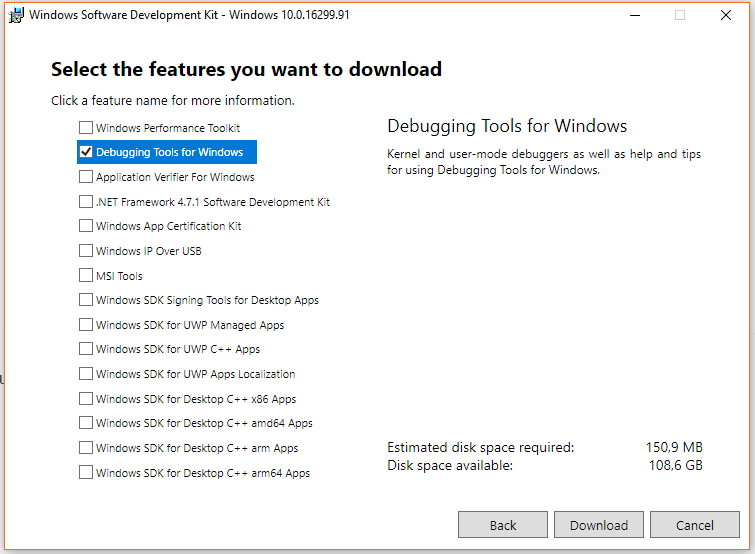
Get WinDbg via the Windows SDK tools: To do so, go to this page and download the latest SDK for Windows, you don’t need to install the whole SDK, only the debugging tools can be installed by selecting only “Debugging Tools for Windows” as in this screenshot:

Once installed you’ll be able to open the memory dump files(*.mdmp) created by sqldumper like a real pro Microsoft employee, but that’s not our scope right now.
Remember where you just installed the debugging tools, since you’ll need one of them right now, specifically symchk.exe, which in my case was installed in “E:\Program Files (x86)\Windows Kits\10\Debuggers\x64\symchk.exe”
Next, identify the folder where SQL Server is installed and get to the \Binn directory (where the executable and dll are), in my case it was “E:\Program Files\SQL Server\MSSQL14.SQL2017\MSSQL\Binn”
Now, you need to use symchk to scan all the DLL and the sqlservr.exe file and download the appropriate debugging symbols from Microsoft, it’s pretty simple, using the command prompt:
cd "E:\Program Files\SQL Server\MSSQL14.SQL2017\MSSQL\Binn"

“E:\Program Files (x86)\Windows Kits\10\Debuggers\x64\symchk.exe” sqlservr.exe /s SRV*c:\symbols*http://msdl.microsoft.com/download/symbols

“E:\Program Files (x86)\Windows Kits\10\Debuggers\x64\symchk.exe” *.dll /s SRV*c:\symbols*http://msdl.microsoft.com/download/symbols
FYI, this syntax works in the command prompt but not in Powershell, you’ll have to fix it accordingly, but it’s pretty easy that we’re using the tool to donwload the symbols from microsoft for the sqlservr executable and all the DLL included in the Binn folder.
The Twist
Perfect! now let’s get back to SSMS, restart the event session, get the new results and – nothing changed.
WHY?
Because SQL Server doesn’t want to lookup debugging symbols all day long, so you have to explicitly activate a trace flag to do so, of course this trace flag may hit your server pretty hard, so, use it only sparingly and never in production.
ALTER EVENT SESSION [WaitCallstack] ON SERVER
STATE = STOP;
GO

DBCC TRACEON (3656,-1)
GO

ALTER EVENT SESSION [WaitCallstack] ON SERVER
STATE = START;
GO
Now, you finally get the decoded frames:
<event name="wait_info" package="sqlos" timestamp="2018-02-16T23:54:44.612Z">
  <data name="wait_type">
    <type name="wait_types" package="sqlos"></type>
    <value>123</value>
    <text><![CDATA[SOS_SCHEDULER_YIELD]]></text>
  </data>
  <data name="opcode">
    <type name="event_opcode" package="sqlos"></type>
    <value>0</value>
    <text><![CDATA[Begin]]></text>
  </data>
  <data name="duration">
    <type name="uint64" package="package0"></type>
    <value>0</value>
  </data>
  <data name="signal_duration">
    <type name="uint64" package="package0"></type>
    <value>0</value>
  </data>
  <data name="wait_resource">
    <type name="ptr" package="package0"></type>
    <value>0x0000000000000000</value>
  </data>
  <action name="callstack" package="package0">
    <type name="callstack" package="package0"></type>
    <value><![CDATA[sqldk.dll!SOS_DispatcherBase::GetTrack+0x7d05
            sqldk.dll!SOS_Task::PreWait+0x136
            sqldk.dll!Worker::OSYieldNoAbort+0x103
            sqldk.dll!MemoryNode::GetPagesAllocated+0x5cd
            sqldk.dll!HRESULT_FROM_SOS_RESULT_Uncommon+0x181b
            sqldk.dll!HRESULT_FROM_SOS_RESULT_Uncommon+0x1209
            sqldk.dll!ResourceMonitor::ResourceMonitorTask+0x202
            sqlservr.exe!_____SQL______Process______Available+0x80dd
            sqldk.dll!SOS_Task::SetDeadlockPriority+0xfd
            sqldk.dll!SOS_Task::SetDeadlockPriority+0x5f8
            sqldk.dll!SOS_Task::SetDeadlockPriority+0x26d
            sqldk.dll!SystemThread::MakeMiniSOSThread+0xd38
            sqldk.dll!SystemThread::MakeMiniSOSThread+0xe30
            sqldk.dll!SystemThread::MakeMiniSOSThread+0x957
            sqldk.dll!SystemThread::MakeMiniSOSThread+0x1149
            KERNEL32.DLL!BaseThreadInitThunk+0x14
            ntdll.dll!RtlUserThreadStart+0x21]]>
     </value>
  </action>
</event>
Don’t forget to stop the session and disable the traceflag when you’ve finished!
ALTER EVENT SESSION [WaitCallstack] ON SERVER
STATE = STOP;
GO

DBCC TRACEOFF (3656,-1)
GO
