
Counters and Waitstats are good boys and useful for understanding what’s going on in your SQL instance, but often are pretty useless by themselves if you don’t know what’s a normal value for your server; For example a value of 100 batch requests/Sec is a value to worry about? It depends ¯\_(ツ)_/¯
What can be a sign of an issue? Something that goes way out of range compared to the average; For example, if your Page Life Expectancy has always been around 2h and then it drops to 20 seconds, there is something going on.
Your monitoring tool should already do this, but what if you’re cheap like me and never used one? PowerBI comes to the rescue!
Starting from the FirstResponderKit PowerBI, on which I’ve already laid my hands on in this previous article, I use the same data to evaluate the changes in the Waitstats/Counters.
The idea is simple, I’ve created a measure that holds the percentage difference between the maximum value in the selected period and the average value over all the available data:
WGrowth =
VAR _MAX = CALCULATE(MAX(BlitzFirst_WaitStats_Deltas[Wait Time, Minutes per Minute]);VALUES(BlitzFirst_WaitStats_Deltas[wait_type]))
VAR _AVG = CALCULATE(AVERAGE(BlitzFirst_WaitStats_Deltas[Wait Time, Minutes per Minute]);ALL(BlitzFirst_WaitStats_Deltas[wait_type]);ALL(BlitzFirst_WaitStats_Deltas[CheckDate]))
return
IF (RANKX( ALL(BlitzFirst_WaitStats_Deltas[wait_type]); DIVIDE(_MAX;_AVG) ;;DESC;Dense) <= 5 ; DIVIDE(_MAX;_AVG) ; BLANK())
In this case I’m working with the Waitstats data, but the principle is similar for the perfmon too;
_MAX is calculated using the values already filtered in the report page, while _AVG uses the whole dataset to get an appropriate overall average value for the specific Waitstat.
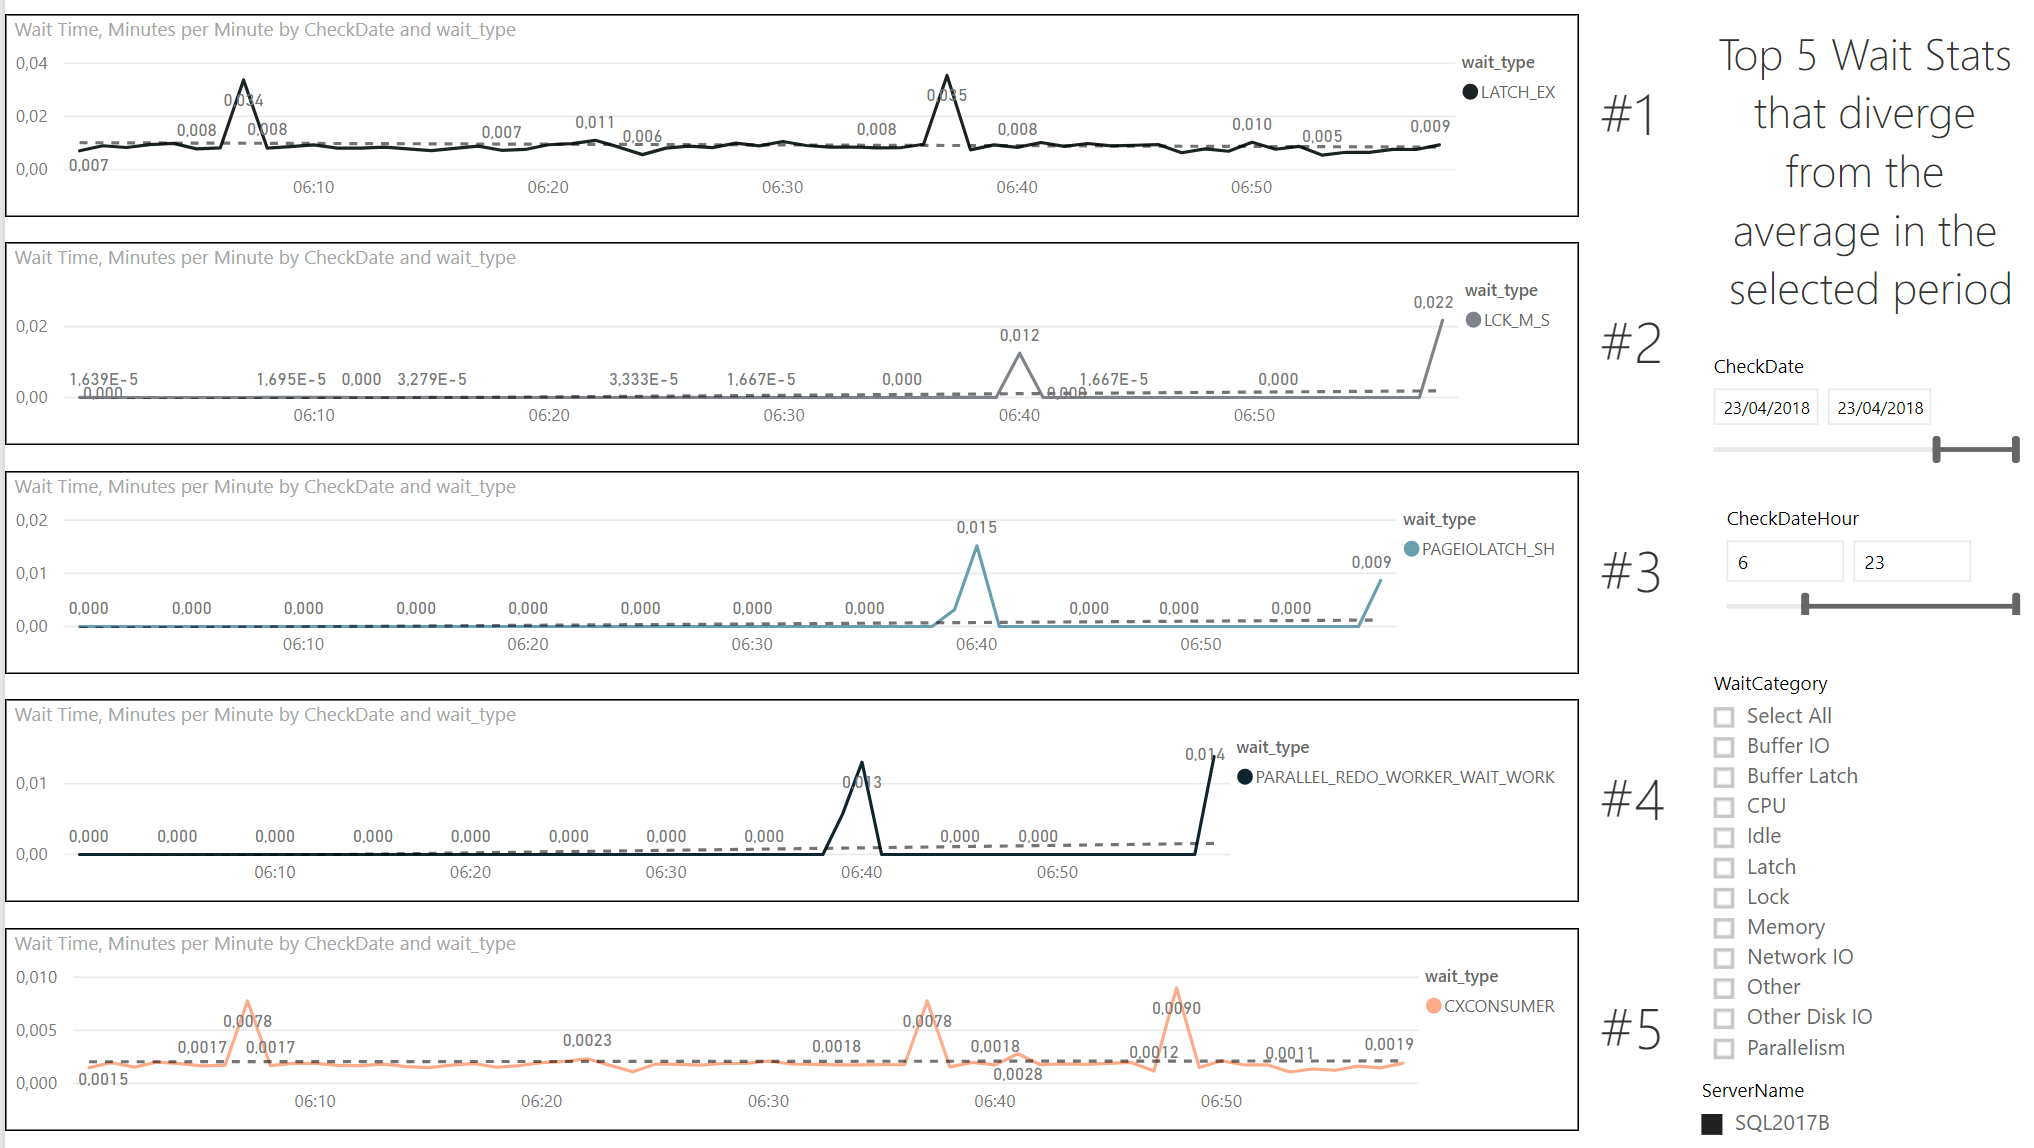
I use the IF and RANKX functions to actually return only the first 5 ranked deviations from average, as I don’t care calculating the deviation for all the wait types.
Then, I’ve created 5 support measures, that help me filter in each graph only the wait type that counts:
Batch Rank 1 =
VAR RankingDimension = VALUES(BlitzFirst_WaitStats_Deltas[wait_type])
RETURN
CALCULATE( [WGrowth];
    FILTER(RankingDimension;
        RANKX( ALL(BlitzFirst_WaitStats_Deltas[wait_type]); [WGrowth];;DESC;Dense) = 1 ))
This measure allows me to actually select only the wait type element in my dimension that corresponds to the specific ranked value calculated in the measure above.
The other 4 are identical, it only changes the rank number selected.
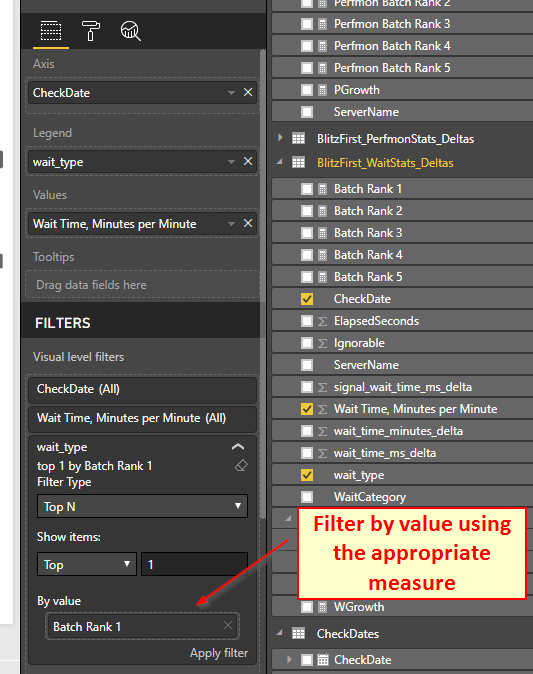
How to filter only the specific wait type in the specific visual? Using the advanced visual filter like so:
If you feel that all of this wasn’t esplicative enough, you’re right; In my defense, I plan to release this as a part of the FirstResponderKit as soon as the bureaucratic machine of GIT commits unravels itself.
Just be patient! Or email me.