A thing that can happen once in a while in a DW is the need to massively update a column in a table, let’s find out.
I’ll be using the same table as last post , the lineitem table of the tpch test by HammerDB, the three contenders are:
- Heap
- Clustered Index
- Clustered Columnstore Index
No other NonClustered index will be included in the base table. You should already know that each NCIndex that contains the updated column in its key (or includes) needs to be updated too, but that’s a no brainer: if I have such index on the table (especially if the updated column is the Key) it’s better to just disable it and rebuild the Index right after the massive update.
Just for reference, here is the base structure of the table that we’re going to update:
CREATE TABLE [dbo].[lineitem_heap](
  [identity] [bigint] IDENTITY(1,1) NOT NULL,
  [l_shipdate] [date] NULL,
  [l_orderkey] [bigint] NOT NULL,
  [l_discount] [money] NOT NULL,
  [l_extendedprice] [money] NOT NULL,
  [l_suppkey] [int] NOT NULL,
  [l_quantity] [bigint] NOT NULL,
  [l_returnflag] [char](1) NULL,
  [l_partkey] [bigint] NOT NULL,
  [l_linestatus] [char](1) NULL,
  [l_tax] [money] NOT NULL,
  [l_commitdate] [date] NULL,
  [l_receiptdate] [date] NULL,
  [l_shipmode] [char](10) NULL,
  [l_linenumber] [bigint] NOT NULL,
  [l_shipinstruct] [char](25) NULL,
  [l_comment] [varchar](44) NULL
) ON [PRIMARY]
GO
I’ll then have two other copies of this table, one with a Clustered Index and one with a Clustered Columnstore index, here is the index definition for both of them:
--TFW when absolutely random naming convention is used ( ͡° ͜ʖ ͡°)
CREATE UNIQUE CLUSTERED INDEX [demoCX] ON [dbo].[lineitem_CX]
(
  [identity] ASC
)
GO

CREATE CLUSTERED COLUMNSTORE INDEX [cx_TEST] ON [dbo].[lineitem_CC]
GO
I’ve then prepared this simple code to test the raw speed of each update:
DECLARE @t1 datetime2, @t2 datetime2;

--HEAP
SET @t1 = SYSDATETIME()

UPDATE dbo.lineitem_heap WITH (TABLOCKX)
    SET l_quantity = l_quantity + 1
WHERE l_quantity % 2 = 0

SET @t2 = SYSDATETIME()

SELECT 'Heap Update', DATEDIFF(millisecond,@t1,@t2) as Milliseconds

--Clustered Index
SET @t1 = SYSDATETIME()

UPDATE dbo.lineitem_CX WITH (TABLOCKX)
    SET l_quantity = l_quantity + 1
WHERE l_quantity % 2 = 0

SET @t2 = SYSDATETIME()

SELECT 'ClusteredIndex Update', DATEDIFF(millisecond,@t1,@t2)  as Milliseconds

--Columnstore
SET @t1 = SYSDATETIME()

UPDATE dbo.lineitem_CC WITH (TABLOCKX) --WITHOUT TABLOCK IT GOES SERIAL
    SET l_quantity = l_quantity + 1
WHERE l_quantity % 2 = 0

SET @t2 = SYSDATETIME()

SELECT 'ClusteredColumnstore Update', DATEDIFF(millisecond,@t1,@t2)  as Milliseconds
Let’s get to the results (on my machine) presto!
But first, disclaimer: all tests are with warmed up cache and ran multiple times to validate the results, moreover this table fits completely in my memory:
- HEAP: 67481ms
- Clustered Index: 52901ms
- Clustered Columnstore: 600744ms (aka 10 minutes)
- Bonus Mistery Item: 39812ms
WHY? HOW? What’s the Mistery Item?? This needs to be explained.
HEAP

This is an actual plan; in a decent&recent version of SSMS (I’m on the latest as of now, 17.5) and SQL Server, if you highlight an item and press F4 (or right click and select properties), the properties plan comes up and you’re able to see the Time and IO statistics for each item, without having to specify “SET STATISTICS TIME, IO ON;” as you would usually do.
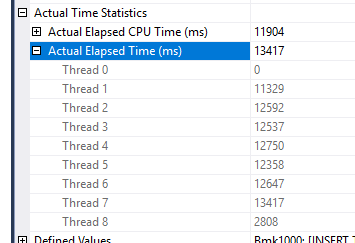
By analyzing the time statistics, we see the following for the UPDATE statement:

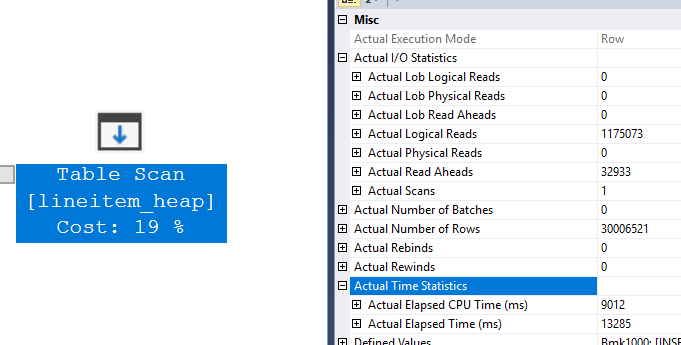
While for the Table Scan operator we see:

Most of the time is spent here actually updating the table, scanning the whole table for the values is actually a fast operation because it’s done in parallel, it takes less than 14 seconds total.
The update itself, by contrary, is done by a single thread, which has to jump around between the various (unordered) pages of the heap to update them.
Clustered Index

I know, you’re thinking “of course it’s faster, your predicate is on the clustering key, it will be a different story if the predicate is on another column”, which is what I was thinking, too.
As far as we can see, however, since we’re dealing with a “massive” update (50% of the table), SQL Server isn’t even seeking ◔_◔
“But is it pushing the predicate down?” Once and for all, to exclude this, I tried to change the predicate column from [identity] to [l_quantity] (since they have been updated before, the same number of rows would be updated) and I couldn’t find any difference in runtime.
So why is it faster? The Scan a little more than half of the total time, way more time than the Heap example, because it’s doing it in a Single Thread as opposed to parallel:

It’s the UPDATE Operation itself that in a Clustered Index is faster, totaling at half of the Heap runtime!
Clustered Columnstore
Why did you do this to me? I TRUSTED YOU! I TRUSTED THE BATCH MODE!
Let’s see the plan:

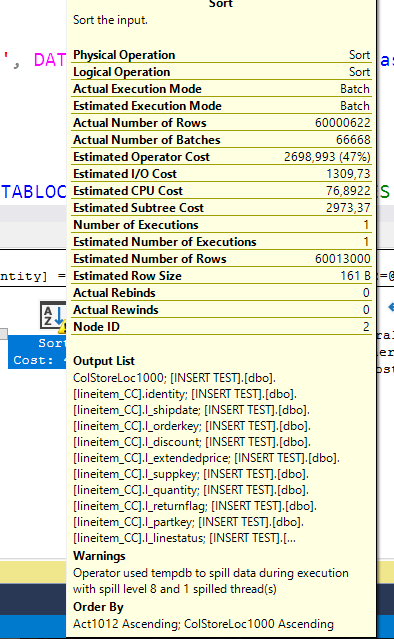
That triangle isn’t really a good sign, let’s see:

Spill level 8 ? That’s a BP-level spill!
At least it ran in batch mode ¯\_(ツ)_/¯
But is it really the worst offender?
By checking the Time statistics for this operator, we see the following:

So, we’re in a bad situation, but not the worse, because the sort operator finishes just over 2.5 minutes, so where are the other 7.5 minutes at?
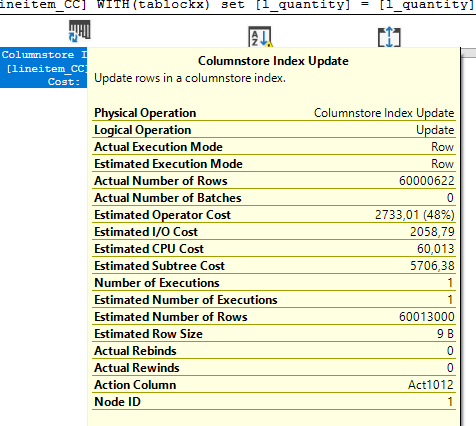
in the index update, of course.
While the read of the pages from disk and the sorting were made in batch mode (even thou, why are we sorting again?) the update itself is a painfully slow single threaded operation (yes, even with the TABLOCKX hint) in row mode.

That’s because the update of the Columnstore Index is done by deleting rows (updating the Delete Bitmap) and inserting the new rows with the updated value in the Delta Store (which is basically a classic b-tree index) which is then compacted by the Tuple Mover as soon as possible; There is no “physical” update statement.
If you have to massively update a Clustered Columnstore Index, just drop it, update it as an heap and rebuild the index. Same thing for a NonClustered columnstore index, if it’s built on a column that you’re going to update massively, drop and recreate it, if not, lucky you it won’t be touched thanks to the columnar storage mode (•̀ᴗ•́)و ̑̑
Heap, but with MAXDOP 1
Here is our bonus item! But how is this possibile?!? ლ(ಠ_ಠლ)
To be fair, I didn’t tell you everything in the previous paragraphs to keep the suspense, if you had the feeling that something was off, you’re right, congrats!
The difference here is very subtle; Take a look at the Time and IO properties for the Table Update operator in the parallel plan:

The operator had to make 30M logical reads to update the data, which took 74 seconds of time (and 47 seconds of CPU time)
In the serial plan, that same operator didn’t have to read any page:

Have you noticed anything else off between the two plans? In the parallel plan, the update statement is reading 30M pages, which is exactly the number of rows to be modified!
Coincidences? I don’t think so.
In fact, the table doesn’t even have close to that number of pages, in fact, it has “only” 1175073 pages.
So what’s the deal?
By analyzing the wait stats during the parallel heap update, you’ll notice that there is a big number of CXPACKET waits (about 320s in 60s), and, since I’m using SQL Server 2017 CU3, CXPACKET is definitely the actionable part of the parallelism wait (read more about CXPACKET and CXCONSUMER for SQL 2017 here).
So in this case WE ARE waiting for parallelism!
The Table Update is a serial operation regardless, but when dealing with a parallel table scan, which continuously feds data to update from multiple threads, it has to access each single row that it needs to update. 8 threads that read are faster than 1 thread that writes, hence the CXPACKET waits.
In the MAXDOP=1 case, the update operation is done as the page is read from memory, which allows to read each page only once; Moreover, we’re making a lot less logical reads, since we’re just reading each page of the heap only once:

Note: I tried, this can’t be hacked to use batch mode (at least in my SQL Server version)
The lesson
The lesson is basically always the same: TEST, TEST, TEST.
I’ve tested this for you, but results may vary and each workflow needs its own test.
