
Most of the support request I get involved with can be summarized with the following keywords: “slow” + “datawarehouse” + “ETL” + “Save us”
What about thinking about ETL performance before it goes bad? Before the system is in production for some time , the data size reaches a decent size which wasn’t tested in DEV and you find out that the system is not able to scale at all?
Here are the steps to success:
- Don’t think about the data that you have right now, think about how many data you’ll have way after the Go Live
- TEST with the biggest dataset possibile.
On the subject, I’m saving you some job by testing how the performance changes when bulk importing data into a table in various conditions, let’s get to the data.
I’m testing this on my local machine, nothing fancy, SQL Server 2017 CU3, only 16GB of ram, 4 cores with HT and a very fast NVME drive for both Data files and Logs, I wanted to test the following conditions:
- Table: Heap vs Clustered Index vs Clustered Columnstore Index
- Recovery Mode: FULL vs BULK_LOGGED (which for bulk operations is basically the same as SIMPLE)
- Hints: No Hints vs TABLOCK (My favorite hint)
In each run I monitored, other than the time to complete the operation, the log growth from a fixed dimension and the wait stats occurred during the insert; Each run was repeated twice, once with the log file starting from the standard 10GB size, and another one repeating the test with the size the Log had grown into to verify how much log growing affected performances.
As you may have noticed, an interactive PowerBI report to analyze the data I’ve gathered (don’t forget to drill down, neat!) and at the end of the post you’ll find a summary table with all the tests.
As source data, I used the lineitem table in the TPC-H database created by HammerDB that I already had on my Instance; You can install it for free and it’s a nice tool to literally hammer your instance with a simulated workload of either TPC-C or TPC-H scenarios. The table has 60 million rows , weights about 2.3GB and it’s a Clustered Columnstore, so reading performance are not a bottleneck.
This is the definition of the table I’m going to insert into:
CREATE TABLE [dbo].[lineitem](
  [identity] [bigint] IDENTITY(1,1) NOT NULL,
  [l_shipdate] [date] NULL,
  [l_orderkey] [bigint] NOT NULL,
  [l_discount] [money] NOT NULL,
  [l_extendedprice] [money] NOT NULL,
  [l_suppkey] [int] NOT NULL,
  [l_quantity] [bigint] NOT NULL,
  [l_returnflag] [char](1) NULL,
  [l_partkey] [bigint] NOT NULL,
  [l_linestatus] [char](1) NULL,
  [l_tax] [money] NOT NULL,
  [l_commitdate] [date] NULL,
  [l_receiptdate] [date] NULL,
  [l_shipmode] [char](10) NULL,
  [l_linenumber] [bigint] NOT NULL,
  [l_shipinstruct] [char](25) NULL,
  [l_comment] [varchar](44) NULL,
 -- CONSTRAINT [PK_lineitem] PRIMARY KEY CLUSTERED
 --(
 -- [identity] ASC
 --) ON [PRIMARY]
) ON [PRIMARY]
This is the query that I’m using to test the inserts:
DBCC SQLPERF('sys.dm_os_wait_stats', CLEAR);
GO

DECLARE @t1 datetime2, @t2 datetime2;

SET @t1= SYSDATETIME();

TRUNCATE TABLE dbo.lineitem;

INSERT INTO dbo.lineitem --WITH (TABLOCK)
       ([l_shipdate],[l_orderkey],[l_discount],[l_extendedprice],
       [l_suppkey],[l_quantity],[l_returnflag],[l_partkey],
       [l_linestatus],[l_tax],[l_commitdate],[l_receiptdate],
       [l_shipmode],[l_linenumber],[l_shipinstruct],[l_comment])
SELECT
       [l_shipdate],[l_orderkey],[l_discount],[l_extendedprice],
       [l_suppkey],[l_quantity],[l_returnflag],[l_partkey],
       [l_linestatus],[l_tax],[l_commitdate],[l_receiptdate],
       [l_shipmode],[l_linenumber],[l_shipinstruct],[l_comment]
FROM   [tpch].[dbo].[lineitem];

--Insert Index Creation Statement here

SET @t2 = SYSDATETIME()

SELECT DATEDIFF(Millisecond,@t1,@t2) as Duration
I’m clearing the Waitstats right before starting the insert query to be able to get a snapshot of what the query was waiting on during the execution.
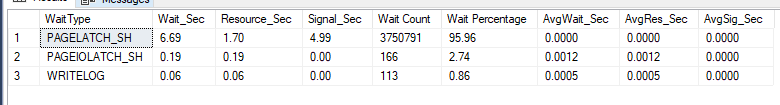
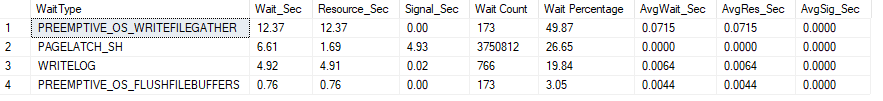
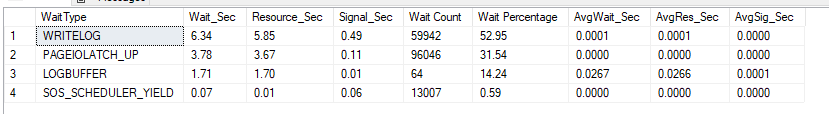
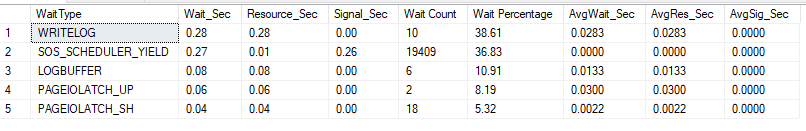
Run #1: Clustered Index, FULL Recovery model, No Hint, 10GB Log
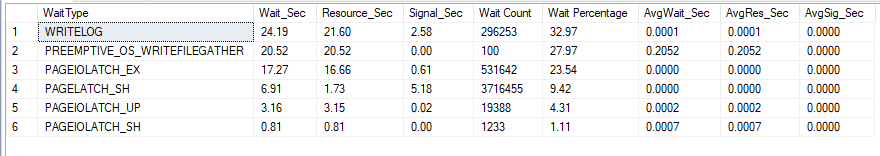
Time: 239085ms
Log Size: 10GB -> 23GB
This should be the slowest run, that we’re taking as a baseline.
The log has grown by 13GB over the preallocated size and it shows in the waitstats too as the waits related to the Log write and Log File file growth
Run #2: Clustered Index, FULL Recovery model, No Hint, 23GB Log
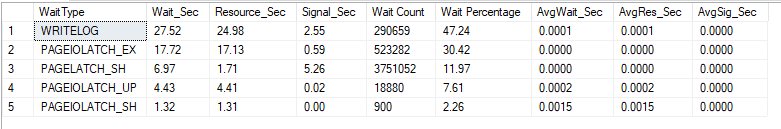
Time: 219969ms
Log Size: 23GB
By having the log already grown to size, the PREEMPTIVE_OS_WRITEFILEGATHER wait is gone, since Windows didn’t have to grow the Log file on disk, it was 10 seconds faster, not much.
Run #3: Clustered Index, FULL Recovery model, TABLOCK, 10GB Log
Time: 239574ms
Log Size 23GB
Regardless of the TABLOCK index, nothing really changed here.
Run #4: Clustered Index, FULL Recovery model, TABLOCK, 23GB Log
Same as #2
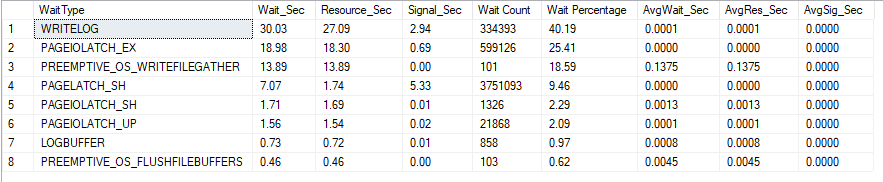
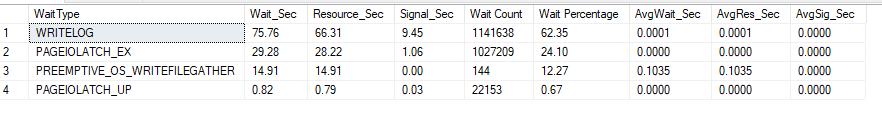
Run #5: Clustered Index, BULK_LOGGED Recovery model, No Hint, 10GB Log
Time: 170744ms
Log: 10GB -> 32GB
By switching to the BULK_LOGGED recovery model we finally see some noticeable improvement in time, the WRITELOG wait stat has gone way down in time but the PREEMPTIVE_OS_WRITEFILEGATHER is still present, as the log file had to grow and for some reason it has grown even more than in the FULL recovery model, while one would expect to grow the same or less; One possible explanation that I have is that, while the operation is running, the Log in the BULK_LOGGED contains both log records and the data pages that were changed by bulk operations (bol)
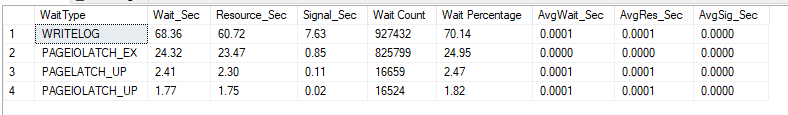
Run #6: Clustered Index, BULK_LOGGED Recovery model, No Hint, 32GB Log
Time: 140099ms
Log: 32GB
With the Log file already grown, we only have a few relevant PAGELATCH waits and the WRITELOG has gone way down, indicating that we’re not waiting on the log anymore, we saved almost 30 second!
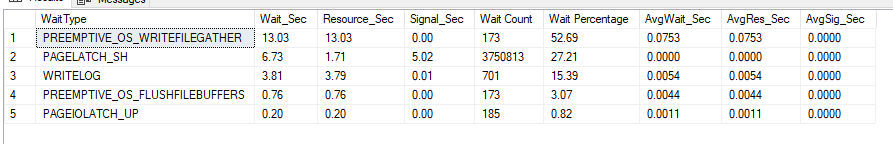
Run #7: Clustered Index, BULK_LOGGED Recovery model, TABLOCK Hint, 10GB Log
Time: 152851ms
Log: 10GB -> 32GB
As expected, we’re still waiting on the Log file to grow, but the TABLOCK hint made this query a little bit faster, so we’re still better off than run #5
Run #8: Clustered Index, BULK_LOGGED Recovery model, TABLOCK Hint, 32GB Log

Time: 136668ms
Log: 32GB
The fastest run yet, as expected not having to wait on the Log File to grow and with a TABLOCK hint we’re not waiting on anything.
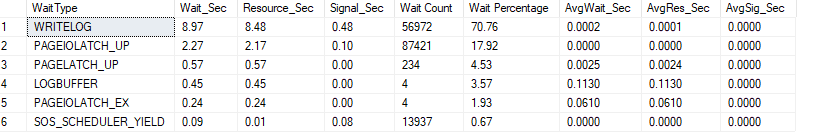
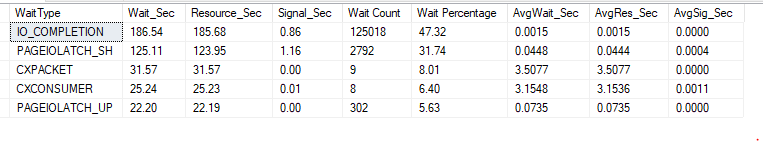
Run #9: Heap, FULL Recovery model, no Hint, 10GB Log
Time: 304027ms
Log: 10GB -> 28GB
What? Wasn’t inserting into a Heap always faster? Not in Full recovery model, a small Log and no Hints, it seems. Slowest run ever, the WRITELOG wait is killing the run.
Run #10: Heap, FULL Recovery model, no Hint, 28GB Log
Time: 270207ms
Log: 28GB
The Log file didn’t have to grow, but we aren’t really in a better position.
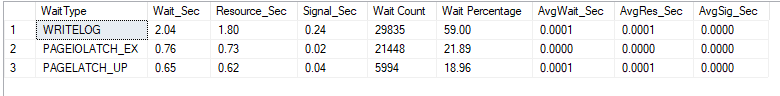
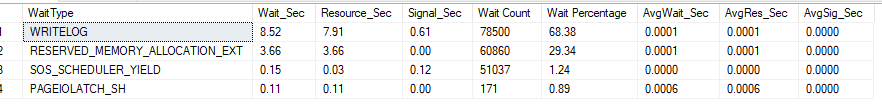
Run #11: Heap, FULL Recovery model, TABLOCK Hint, 10GB Log
Time: 97065ms
Log: 10GB
Finally we’re seeing good results! Even with the Full recovery model the insert with the TABLOCK hint more than halved the insert time, the Log file didn’t grow at all
Run #12: Heap, FULL Recovery model, TABLOCK Hint, 10GB Log
Same as #11, just because, just to verify.
Run #13: Heap, BULK_LOGGED Recovey mode, no Hint, 10GB Log
Time: 291038ms
Log: 10GB -> 29GB
Losing the hint makes us lose all the performance benefits, the situation is basically the same as using the FULL recovery model.
Run #14: Heap, BULK_LOGGED Recovey mode, no Hint, 29GB Log
Time: 276963ms
Log: 29GB
As expected, a little bit faster since we didn’t have to grow the log file, but nothing else.
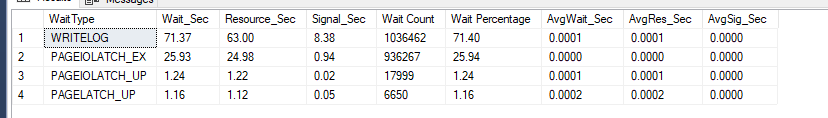
Run #15: Heap, BULK_LOGGED Recovey mode, TABLOCK Hint, 10GB Log
Time: 77588ms
Log: 10GB
Here is where the real money is! Lowest time ever, no additional Log Growth, as fast as it can get.
But what if I then need to query this table, so I need at least a Clustered Index? Let’s see how much time it takes to create it:
Run #16: Run #15 + Create the Clustered Index
Time: 135376
Log: 10GB
In this case, by first inserting the data into the Heap with a TABLOCK, we create the index right after inserting all the records.
The total time of the operation is basically the same one of inserting the records directly in the Clustered index with TABLOCK and BULK_LOGGED recovery model, the only difference is that the log didn’t grow to 32GB but stayed at the original size.
Run #17: Clustered Columnstore, Full Recovery Model, No Hint, 10GB Log
Time: 245172ms
Log: 10GB
Throwing Columnstore into the mix, we’re seeing that for this kind of table structure/Data doesn’t really performs any better than a classic Clustered Index, but in this case the log didn’t need to grow more than the prefixed 10GB size.
I expected better performance from this test, probably I’ll get some additional benefits in a machine with more ram, even if I’m dealing only with 2.3GB of data in 16GB of RAM the columnstore may benefit from a little bit more memory.
Run #18 to #21: All the various combinations of HINT/Recovery Model
Since Columnstore doesn’t need the TABLOCK hint to run minimally logged, these tests offer no real difference than the last one and were made/included just for completeness.
Log size never exceeds 10GB and the time is always around the same with some small variability related to the recovery model.
Run #22: Run #15 + Columnstore Creation
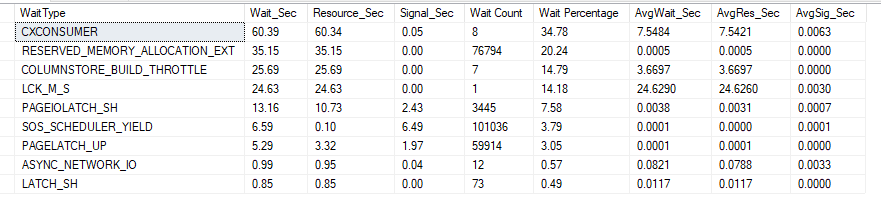
Time: 133218ms
Log 10GB
Even if in these test Columnstore wasn’t ideal to straight insert into (again, probably a limitation of my machine), when creating the index in a second time we basically get the same results as #16
However, it has the most interesting wait stats yet, as it shows that the index creation was done in parallel and that indeed I need way more than 16GB of ram to demonstrate the Columstore glory.
Round Up:
So, what’s best? As always, it depends.
If you have to get it done and just need the data in the table in the fastest way, then go ahead with a Heap and TABLOCK (I guess you’ll create your indexes Online right after)
If the data needs to be ready in an indexed table, then you can either create the index before or after the insert, the time will be the same but the transaction log will grow to a bigger size while the operation is running in the first case, maybe keep that in mind if you’re in a log shipping scenario.
The definitive answer is: TEST, TEST, TEST.
Finally, here’s table with all the results neatly organized:
| Run # | To | Hint | Recovery Mode | Starting Log Size (MB) | Ending Log Size (MB) | Time |
|---|---|---|---|---|---|---|
| 1 | Clustered | None | FULL | 10248 | 23176 | 239085 |
| 2 | Clustered | None | FULL | 23176 | 23176 | 219969 |
| 3 | Clustered | TABLOCK | FULL | 10248 | 23688 | 239574 |
| 4 | Clustered | TABLOCK | FULL | 23688 | 23688 | 222865 |
| 5 | Clustered | None | BULK_LOGGED | 10248 | 32392 | 170744 |
| 6 | Clustered | None | BULK_LOGGED | 32392 | 32392 | 140099 |
| 7 | Clustered | TABLOCK | BULK_LOGGED | 10248 | 32392 | 152851 |
| 8 | Clustered | TABLOCK | BULK_LOGGED | 32392 | 32392 | 136668 |
| 9 | Heap | None | FULL | 10248 | 28680 | 304027 |
| 10 | Heap | None | FULL | 28680 | 28680 | 270207 |
| 11 | Heap | TABLOCK | FULL | 10248 | 10248 | 97065 |
| 12 | Heap | TABLOCK | FULL | 28680 | 28680 | 99071 |
| 13 | Heap | None | BULK_LOGGED | 10248 | 28936 | 291038 |
| 14 | Heap | None | BULK_LOGGED | 28936 | 28936 | 276963 |
| 15 | Heap | TABLOCK | BULK_LOGGED | 10248 | 10248 | 77588 |
| 16 | Heap + CX Creation | TABLOCK | BULK_LOGGED | 10248 | 10248 | 135376 |
| 17 | Clustered Columnstore | None | FULL | 10248 | 10248 | 245172 |
| 18 | Clustered Columnstore | None | FULL | 10248 | 10248 | 242231 |
| 19 | Clustered Columnstore | TABLOCK | FULL | 10248 | 10248 | 251289 |
| 20 | Clustered Columnstore | None | BULK_LOGGED | 10248 | 10248 | 235741 |
| 21 | Clustered Columnstore | TABLOCK | BULK_LOGGED | 10248 | 10248 | 245408 |
| 22 | Heap + Columnstore Creation | TABLOCK | BULK_LOGGED | 10248 | 10248 | 133218 |
[…] massively update a column in a table, let’s find out. I’ll be using the same table as last post , the lineitem table of the tpch test by HammerDB, the three contenders […]