As my “community service” this month, I’ve worked on this neat (I hope!) PowerBI report (and companion stored procedure) to easily analyze all what you wanted to know about your Agent Jobs execution, but were too afraid to ask to the standard Reports in SSMS.
This is part of the FirstRespondersKit toolkit, which I encourage you to check out.
Installation:
- Install the sp_BlitzJobInfo stored procedure wherever you want
- If you install this in the master database you can launch it from any database ( remember, “sp_” stands for “special”, not for “stored procedure”) or you can install it wherever you like.
- If you install this in the master database you can launch it from any database ( remember, “sp_” stands for “special”, not for “stored procedure”) or you can install it wherever you like.
- Open Up the PowerBI template file
- It will ask you for the name of your instance, and then the Database name where you’ve installed the procedure
- Enjoy
- There wasn’t really anything special as far as the installation goes, but I like making lists.
Report Pages Overview
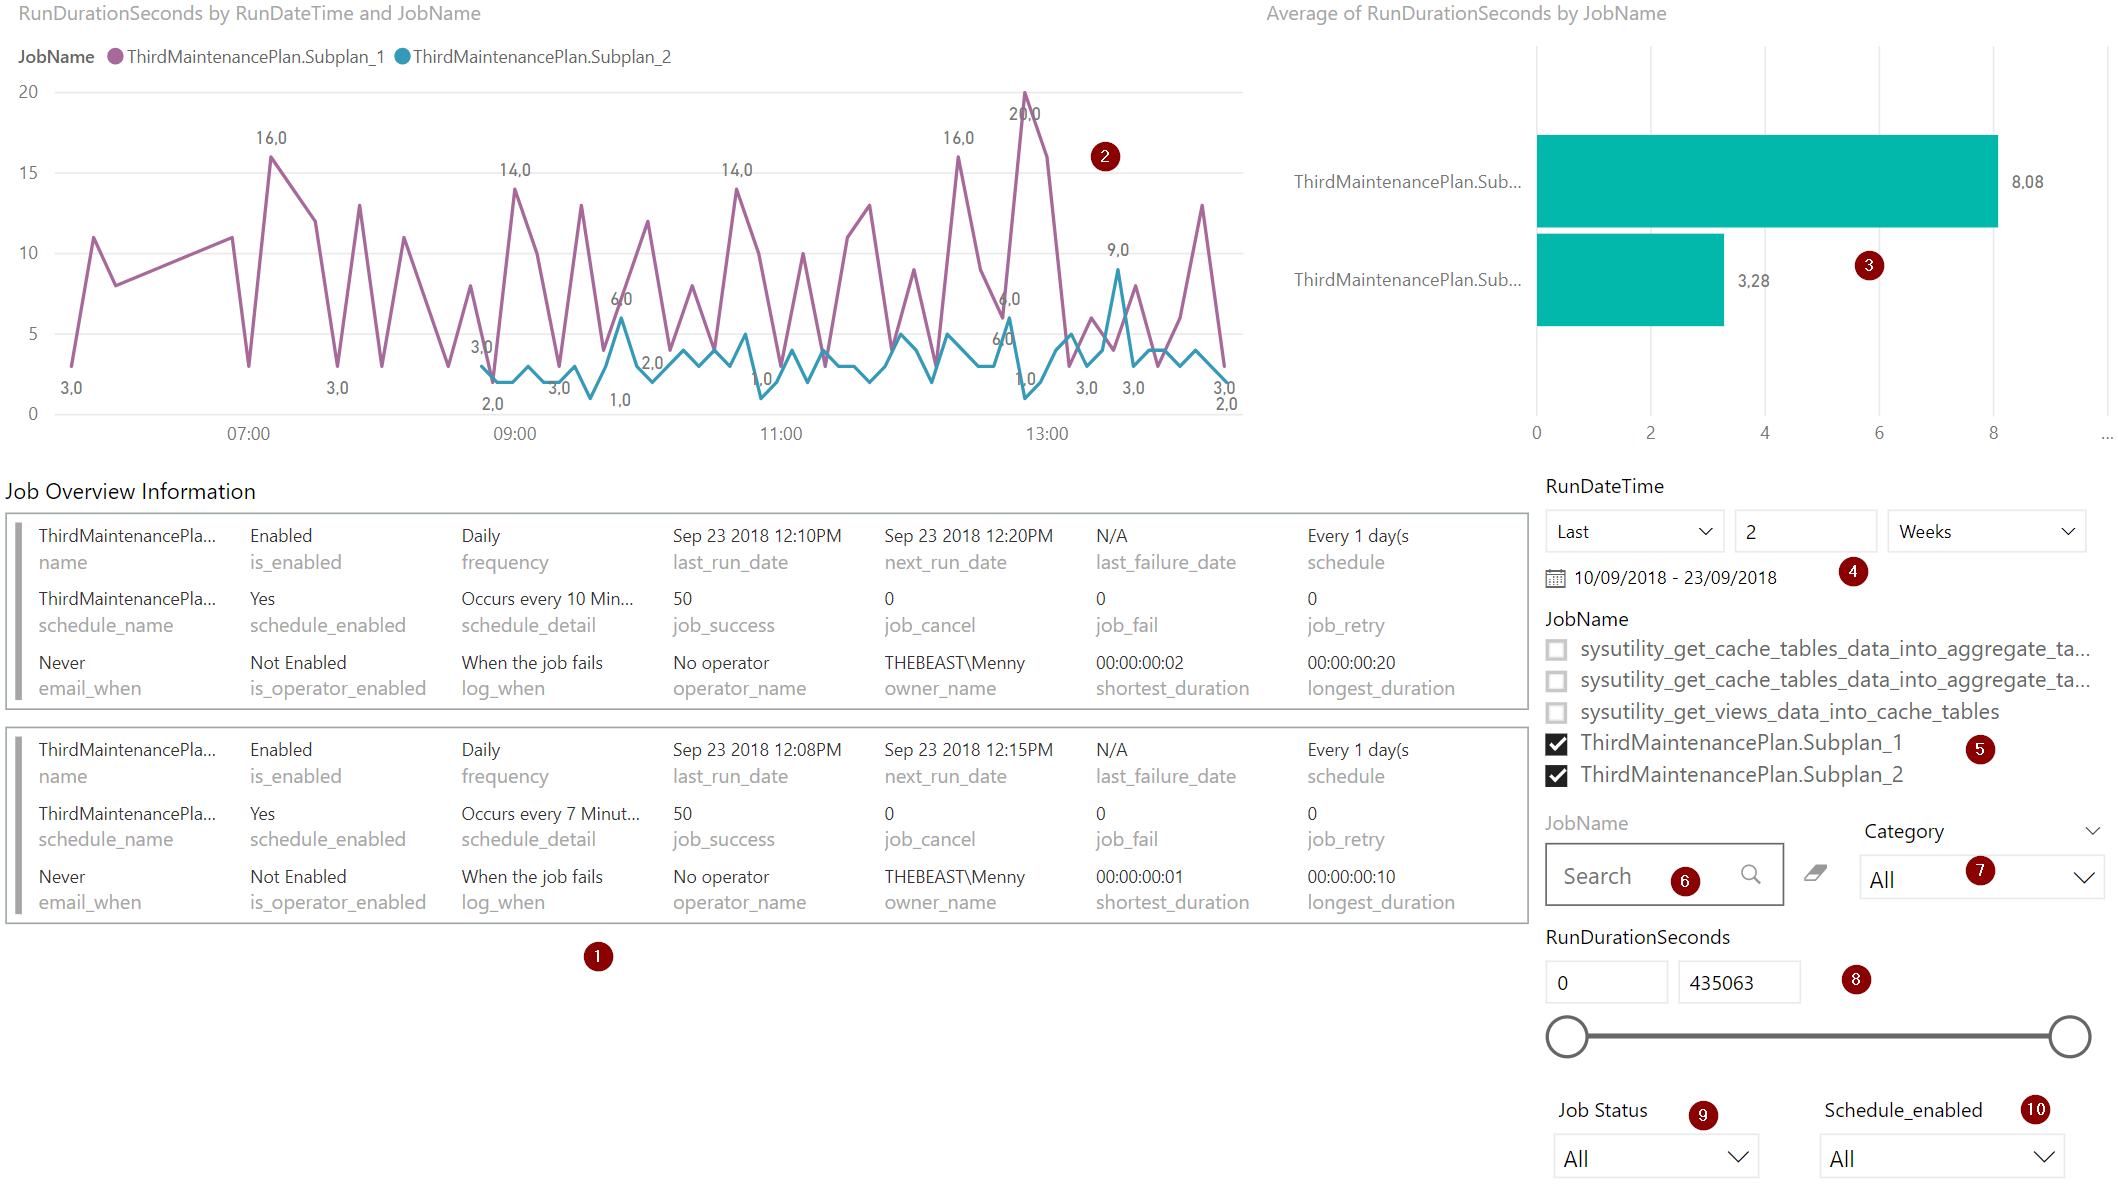
Jobs Page

- Job Overview Information: Lists all the major information that you need to know about your job: Name, Status, Schedule, Run Date, Alerts, etc..
- Performance Graph: Shows you the performance of the selected job(s) over time
- Duration Overview: A drill-down graph to quickly identify the longest running jobs and the critical steps inside them
- Time filter, to select the period of time to analyze
- Job Filter List: A list to select only the jobs that you care about
- Job Search: Don’t want to scroll down the list? Too many Jobs? Use the search function!
- Category Filter: Filter by category (!)
- Run Duration Filter: Filter by Jobs running for longer than X seconds
- Job Status: Filter Enabled/Disabled Jobs
- Schedule Filter: To filter only the jobs with an active schedule, or viceversa
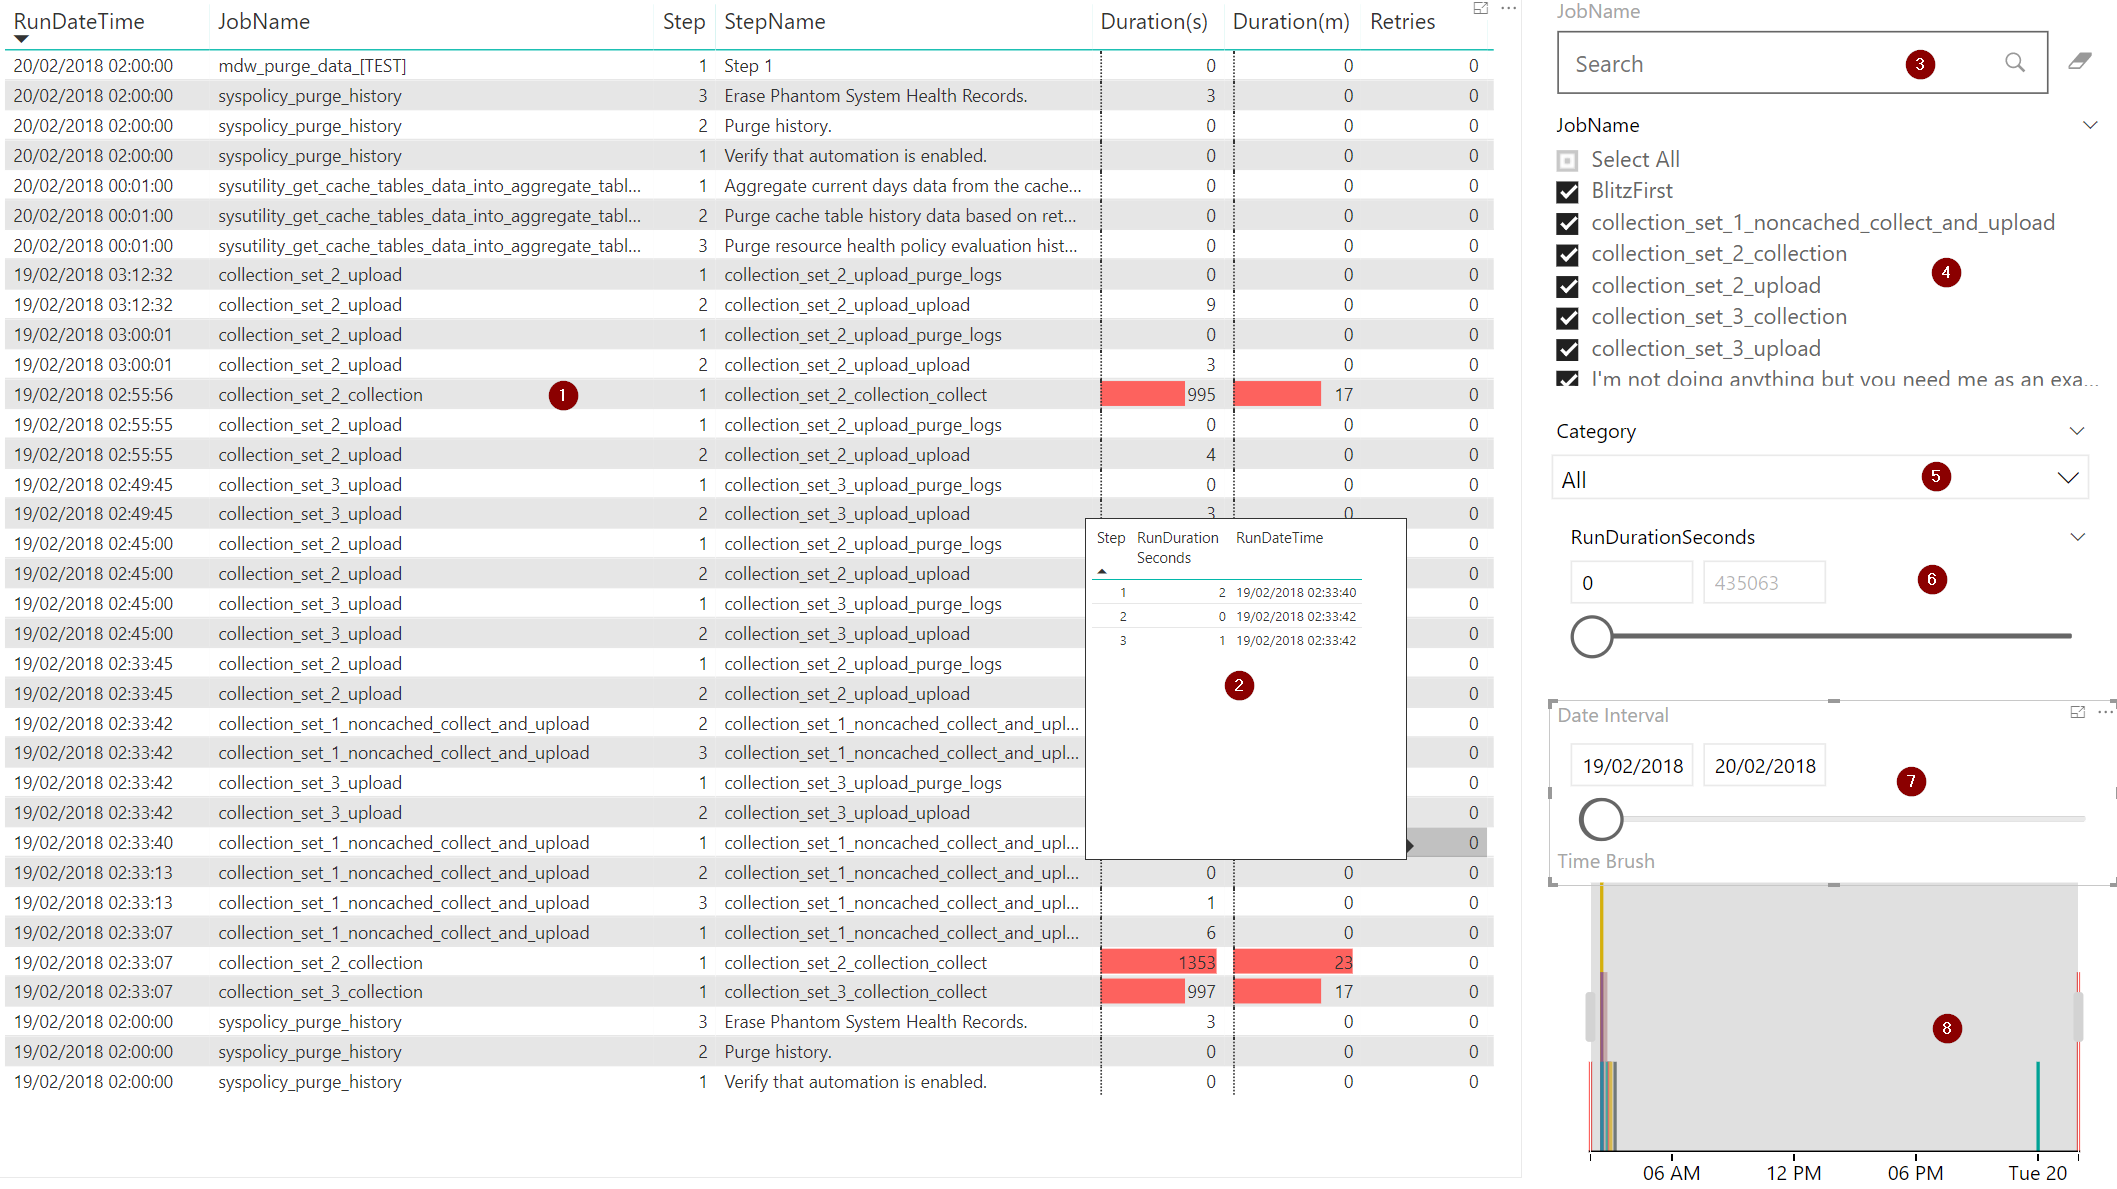
Job Execution Timeline

This report page is when you want to know what the hell was going on in a certain period of time, and how things proceeded.
- Job Steps Timeline: With all the details you need, Job Name, Step Name, Duration, etc..
- Job Execution Tooltip: By hovering over a row in the table, you’ll see the complete timeline of all the steps of the related job execution, in order to have an overview of the Job on top that specific step execution
- (to 7): The usual filters
- Time brush filter: In order to have a finer control over the time interval that you want to analyze
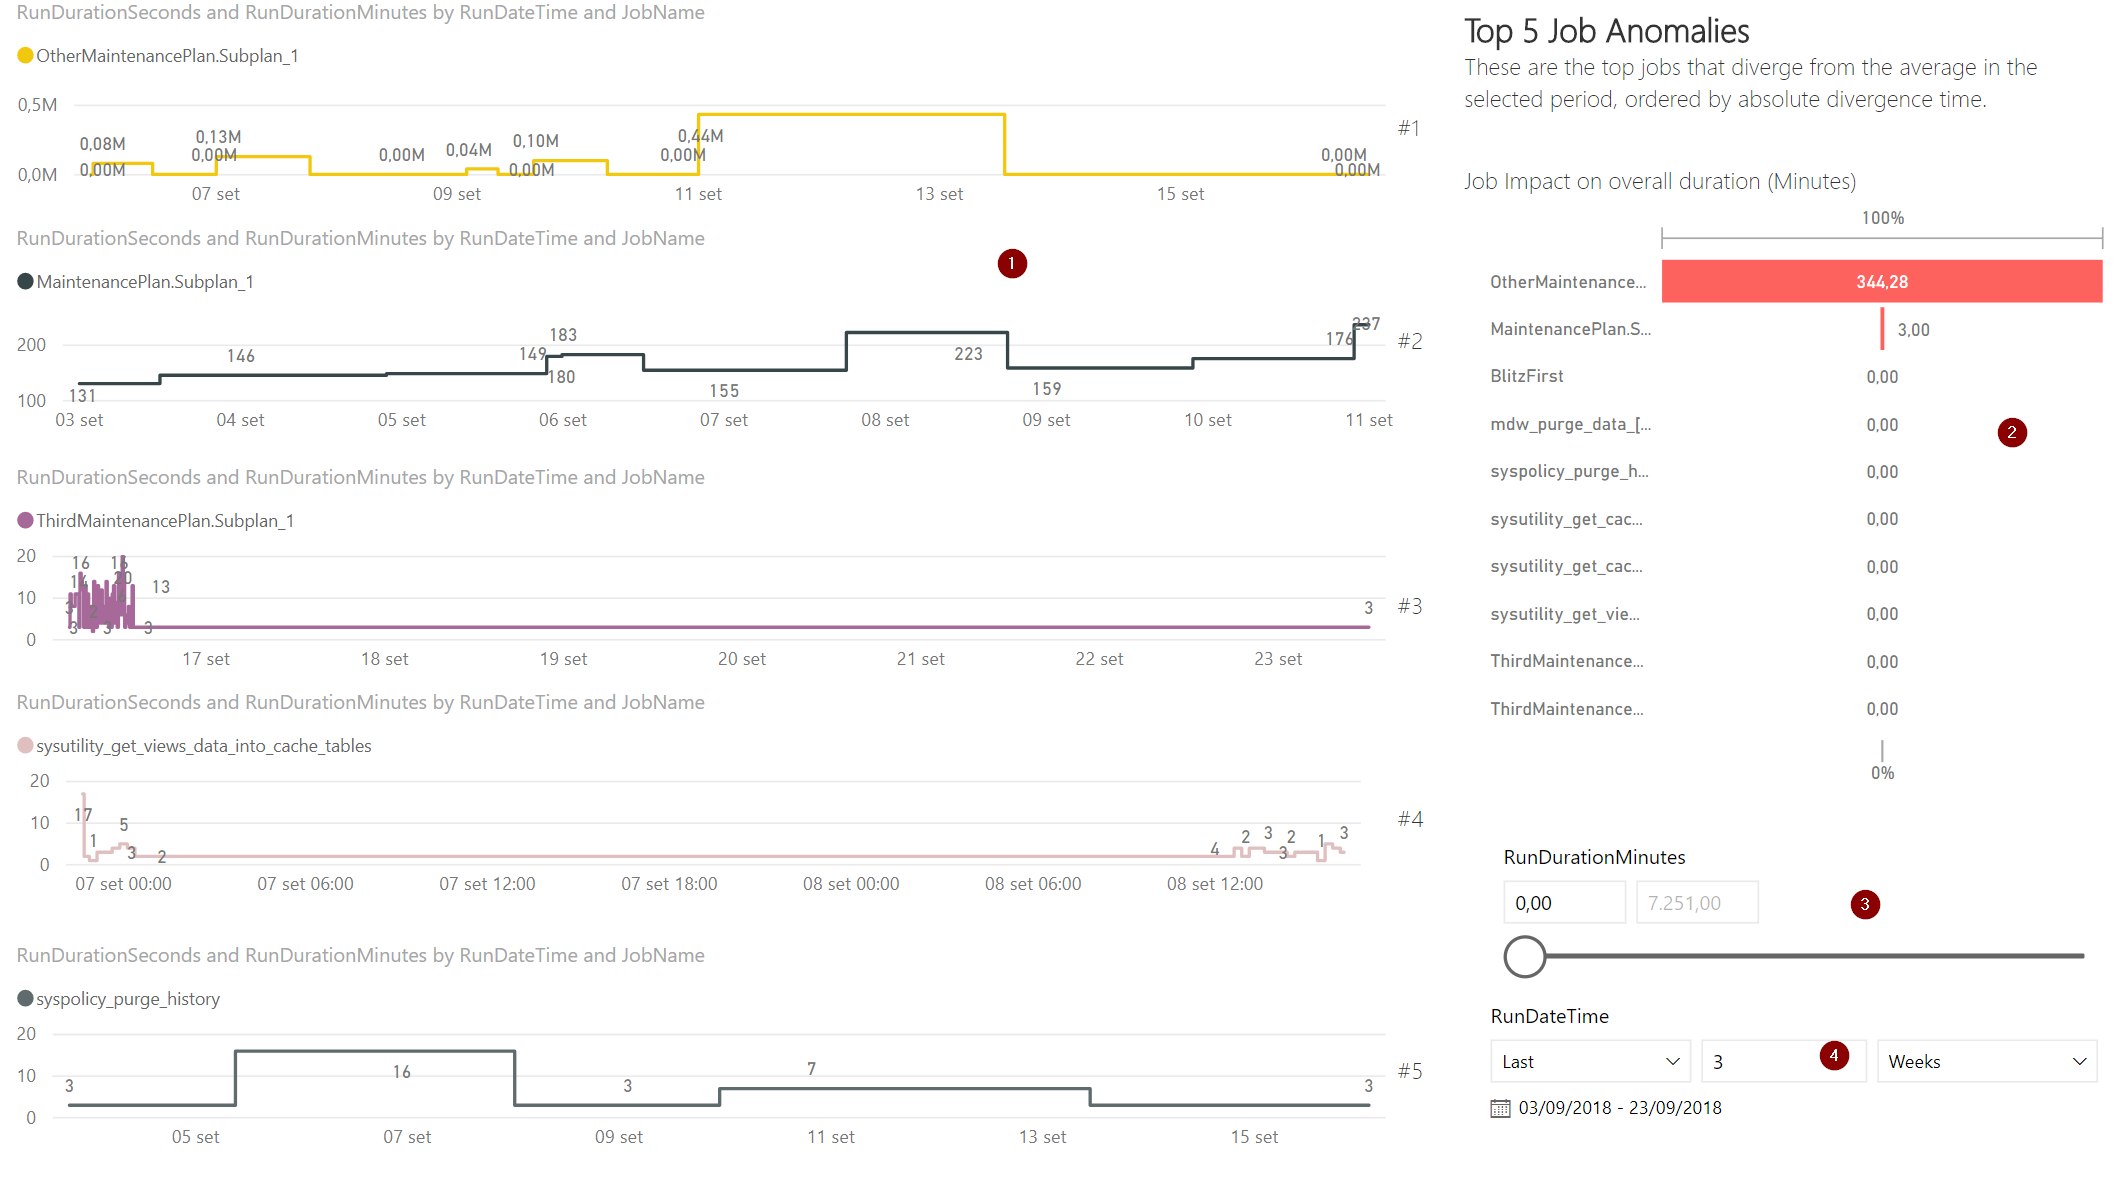
Job Anomalies

This page shows the top 5 Jobs that are deviating from the average (related to their absolute value)
- Job Graphs: The duration graph of the top 5 deviant jobs
- Job Impact on overall duration: The overall impact of each job on the overall job duration on your instance
- The usual filters
Maintenance Plans
If you really have to use maintenance plans, this as least allows you to check on them:
- Plan Filter/List: All your plans are here
- DatabaseName: All the databases that apply to the selected plan(s) are here
- Task: All the tasks that run on the above selected Maintenance Plan(s) and Database(s)
- Task Details: All the details of the selected stuff above
- Average Plan Duration: A duration overview of the selected plan(s)
- Plan Duration Over Time: The plan duration over time
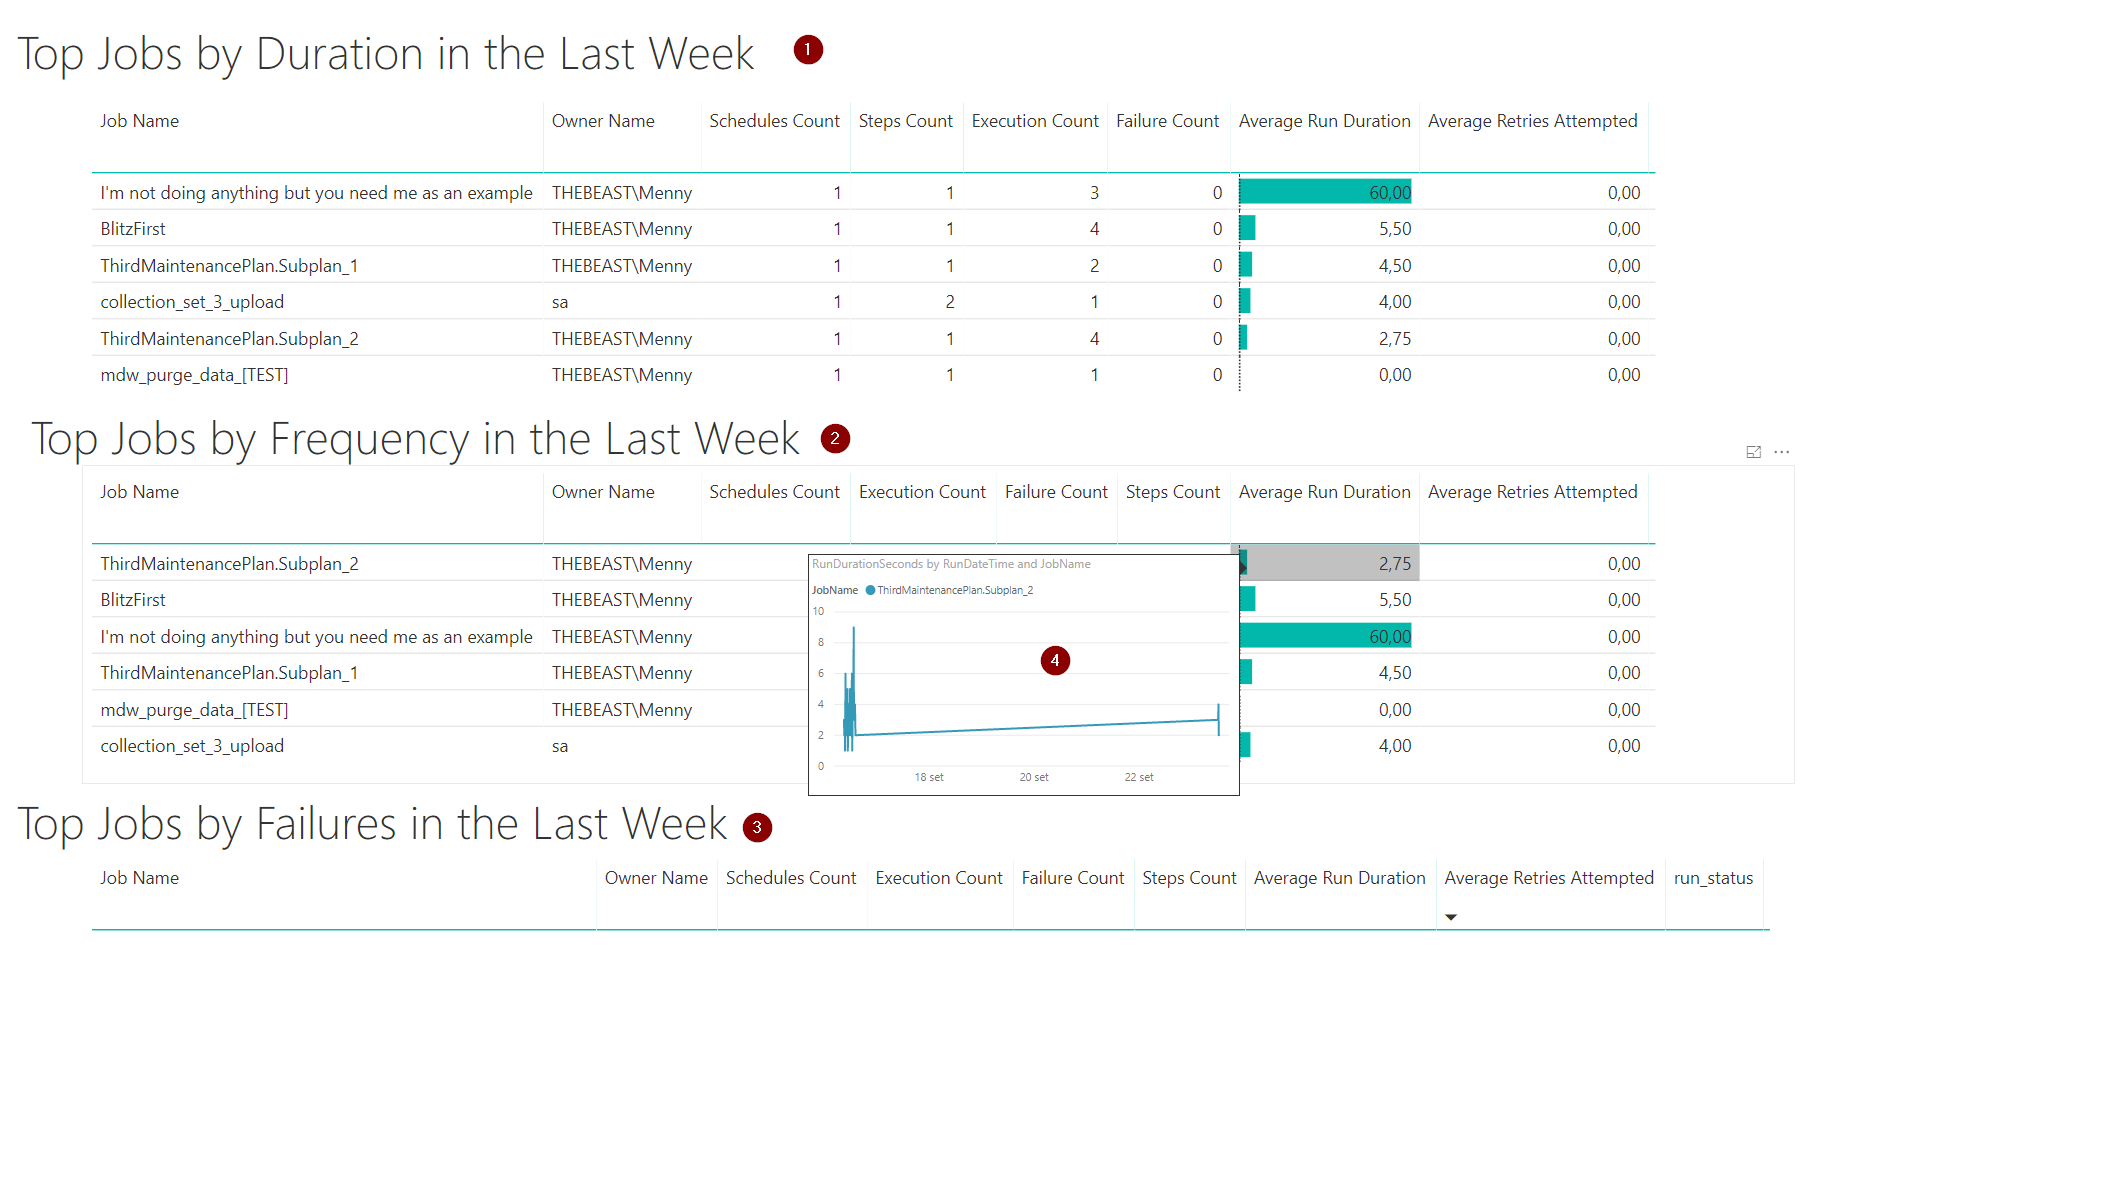
Top N Job List

This is the same as the SSMS “Top 20 Jobs by *” report (literally, I’ve used the same queries that SSMS uses)
- Top Jobs by Duration in the Last Week: ¯\_(ツ)_/¯
- Top Jobs by Frequency in the Last Week: ¯\_(ツ)_/¯
- Top Jobs by Failures in the Last Week: ¯\_(ツ)_/¯
- Job Duration Graph Tooltip: The added value for this report vs the standard one, by hovering on each row you’ll see the duration graph for the job
Downloads and Support
You can download the package with the stored procedure and the PowerBi template Here:
Head to the FirstRespondersKit GitHub page for support!

Hello I cannot find the stored proc in responder kit. Do you know how can i download that?
Hey,
you can find it in my GitHub repository: https://github.com/EmanueleMeazzo/tsql.tech-Code-snippets/blob/master/Troubleshooting/sp_BlitzJobinfo.sql
Hello Emanuele, I guess this is for one particular server, I want to view this data for all of my production servers, We are ready to copy the job history on centralized repository, Do you have any such report for all servers that would be great.
I really like this power BI report
Hi Lakshmi,
I think I don’t have anything “ready to go”, but it should be pretty easy to implement, just add a column for the Server name in the Job tables of your repository and add a filter at the Report Level in PowerBi filtering for a specific server.
If you want to see an overall status of all the servers, however, I think you’re better off creating additional report page(s) for that
Hi Emanuele,
This looks great! I’m having an issue with the code though and can’t seem to figure out why.
“Msg 102, Level 15, State 1, Procedure sp_BlitzJobinfo, Line 24 [Batch Start Line 0]
Incorrect syntax near ‘;’
The very first instance of ‘GO’ keeps giving me this error, but I don’t know why. Any ideas? I would LOVE to use this PBI report
Hey Sam,
what’s the SQL Server version you’re running this in?