
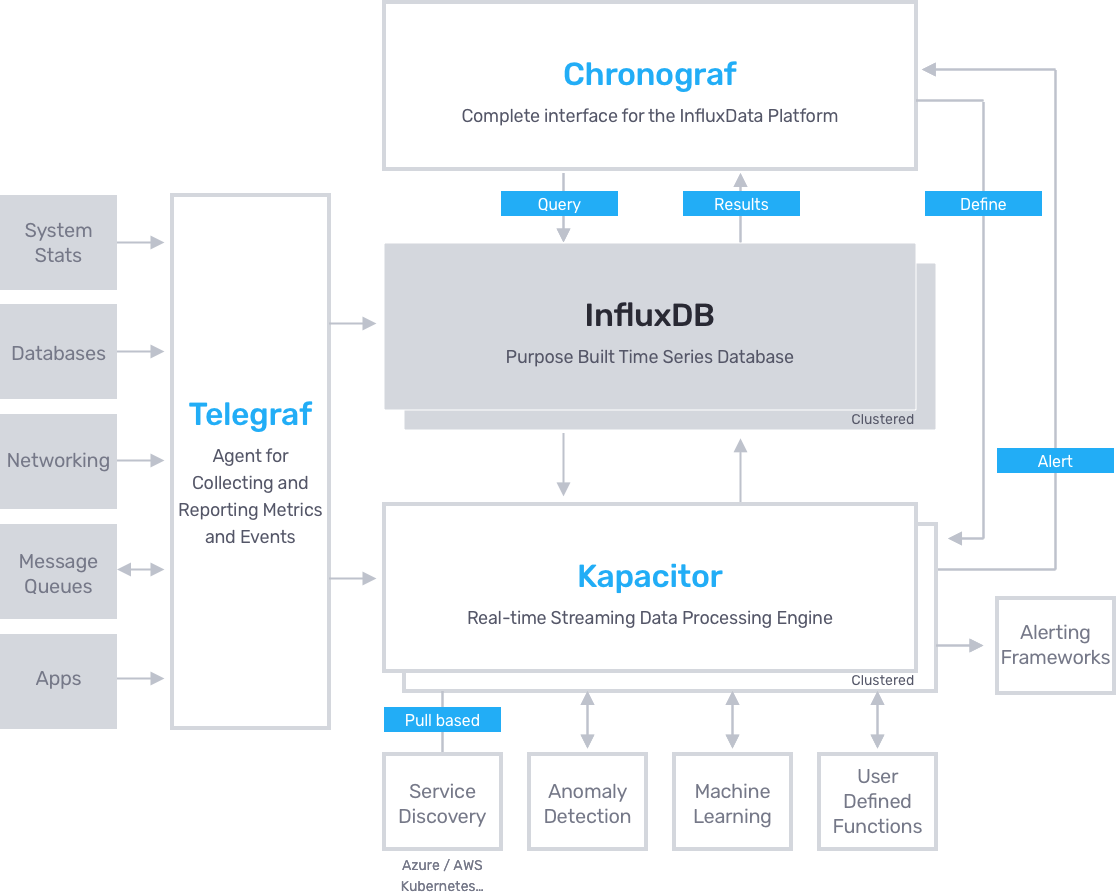
Oh boy, this is a spinoff of my previous post on “How To Use Grafana (On Docker) To Monitor Your Sql Server (Eventually On Docker Too) – Feat. Influxdb And Telegraf” , which is a nice solution, but I wanted to create something that’s even more easy to deploy, more configurable and without the need of actually knowing influxSQL or learning the influxDB Telegraf schema; for these reasons, I’m going all-in on the TICK Stack:
- Telegraf: a plugin-driven server agent for collecting and sending metrics and events from databases, systems, and IoT sensors.
- InfluxDB: a time series database designed to handle high write and query loads.
- Chronograf: allows you to quickly see the data that you have stored in InfluxDB so you can build robust queries and alerts. It is simple to use and includes templates and libraries to allow you to rapidly build dashboards with real-time visualizations of your data.
- Kapacitor: a native data processing engine for InfluxDB , we’ll use it to determine when an alert must be raised based on the change of data over time
Basically, I’m switching Grafana for Chronograf and adding Kapacitor for alerting. The switch to Chronograf makes it easier to write InfluxQL queries because it offers an easy to use query composer, which didn’t work as well in Grafana, however, we’re losing the possibility to query directly the SQL Instance(s) in order to get additional business metrics other than the technical ones gathered by influxDB via Telegraf.
An easier deploy with Docker-Compose
As opposed to configuring each image and container independently, I’m now using docker-compose to define the status of my container group using a YAML file:
version: '3.7'
services:
  influxdb:
    image: "influxdb:latest"
    hostname: "monitoring_influxdb"
    container_name: monitoring_influxdb
    ports:
        - "8086:8086"
    volumes:
        - "influx-data:/var/lib/influxdb"
    networks:
        - monitornet
  chronograf:
    image: "chronograf:latest"
    hostname: "monitoring_chronograf"
    container_name: monitoring_chronograf
    ports:
        - "8888:8888"
    volumes:
        - "chronograf-data:/var/lib/chronograf"
    networks:
        - monitornet
  telegraf:
    image: "telegraf:latest"
    hostname: "monitoring_telegraf"
    container_name: monitoring_telegraf
    volumes:
        - "/D/SQL/telegraf.conf:/etc/telegraf/telegraf.conf"
    networks:
        - monitornet
  kapacitor:
    image: "kapacitor:latest"
    hostname: "monitoring_kapacitor"
    container_name: "monitoring_kapacitor"
    volumes:
        - "kapacitor-data:/var/lib/kapacitor"
    environment:
        - "KAPACITOR_INFLUXDB_0_URLS_0=http://monitoring_influxdb:8086"
    ports:
        - "9092:9092"
    networks:
        - monitornet


volumes:
    telegraf-data:
    chronograf-data:
    influx-data:
    kapacitor-data:

networks:
    monitornet:
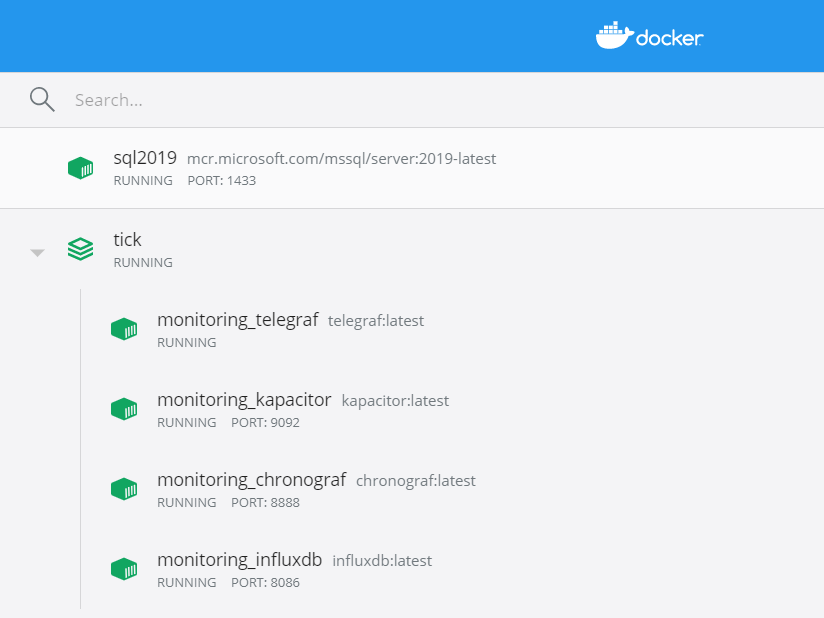
With this code I’m basically spinning up the 4 required containers, assigning each one a separate volume to persist the data and placing them all on the same network in order to communicate with each other.
Telegraf Configuration and Windows filesystem
As in the previous post telegraf needs to be configured in order to connect to your SQL Instances (or any other of the hundreds of plugins); please refer to my previous post on how to generate a configuration file quickly.
Note that if you’re monitoring something that’s on docker you have to add it to this docker monitoring network in order for telegraf to be able to reach it; seek a proper Docker networking configuration guide if you’re not able to reach whatever you want to monitor in another container.
Now, there are multiple ways to follow through, the configuration file can be copied back in the container using the docker CLI or it can be mounted in the container directly from your filesystem; I prefer the latter as during the testing period it’s easier to open up the configuration file with my editor of choice and making changes on the fly.
There is however a difference between Linux Hosts and Windows Hosts: notice Line 28, if Docker is running on a Linux machine just use the path of your config file and that’s it, however, in a Windows host you have to write the Path of your file as unix-like
e.g. C:\my\path\to\file.conf becomes /c/my/path/to/file.conf
That’s not enough, however, as in a windows host, as the Compose CLI Reference states, the COMPOSE_CONVERT_WINDOWS_PATHS Environment variable should be set to 1 in a windows environment, why it isn’t by default when installing Docker on windows? Nobody knows.
How do you set an environment variable? Like so:
#Temporary assignment
$env:COMPOSE_CONVERT_WINDOWS_PATHS = 1

#Add permanently to Profile
Add-Content -Path $Profile.CurrentUserAllHosts -Value '$env:COMPOSE_CONVERT_WINDOWS_PATHS= 1"
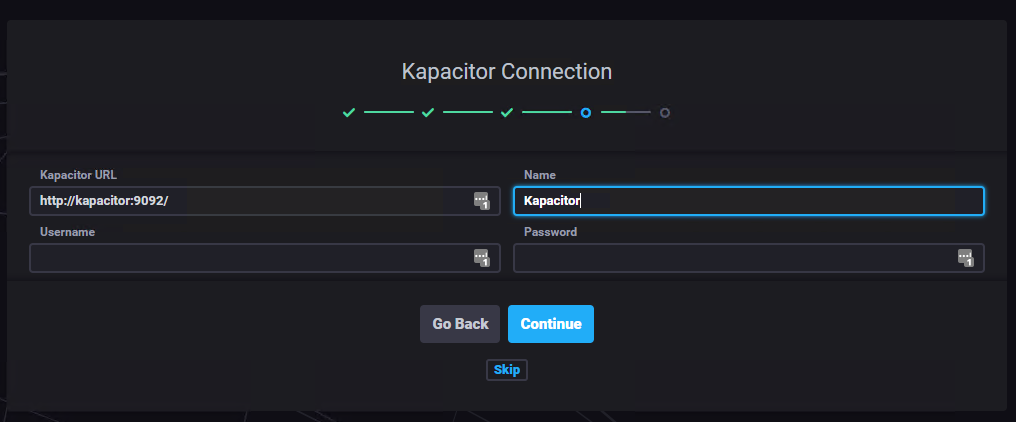
Kapacitor Configuration
As opposed to setting the Kapacitor influxDB instance manually via a configuration file, the Environmental variable, see line 38.
KAPACITOR_INFLUXDB_0_URLS_0 is set with the URL of the influxDB instance (which is easy, since we defined its name just some row before), so we don’t have to do to anything else to configure Kapacitor, as additional configuration can be done via Chronograf later.
Briging it up
Bringing everything up is actually super simple, you’ll need Docker Compose, which is installed alongside docker on Windows and an optional component on Linux.
Save the code above into any folder as docker-compose.yaml and then just type:
docker-compose up
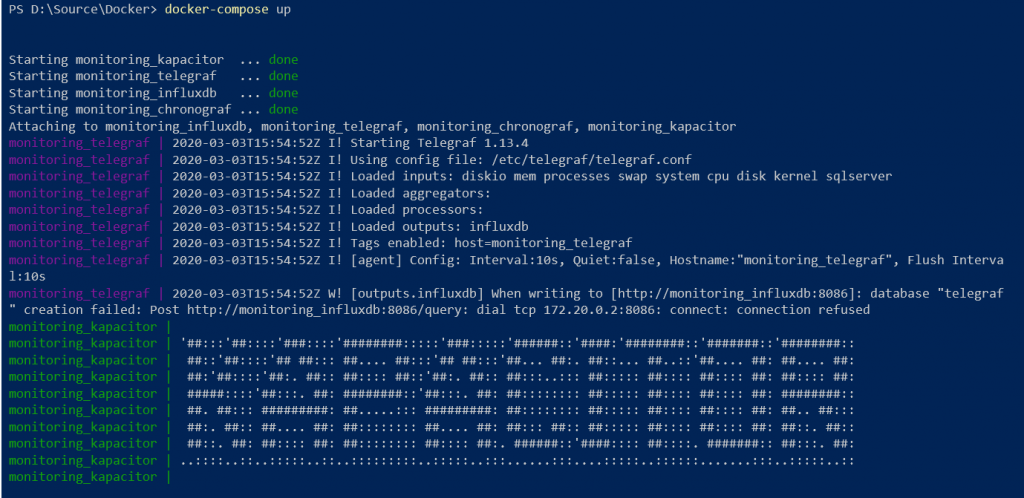
PS: Don’t mind the error in the screenshot above, the creation of the container was so fast that influxDB wasn’t fully spun up and ready to accept queries when telegraf started making requests, it will fix itself in the next few milliseconds.
Chronograf
Chronograf is the data visualization interface dedicated to influxDB
Opening up the URL 8888 , you’ll be presented with this screen:
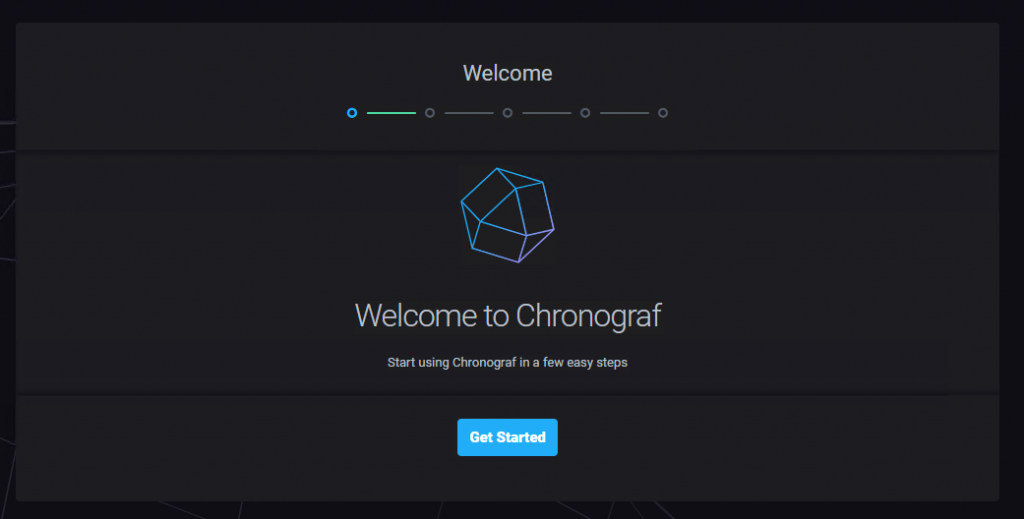
There just a couple of simple steps to take care of:
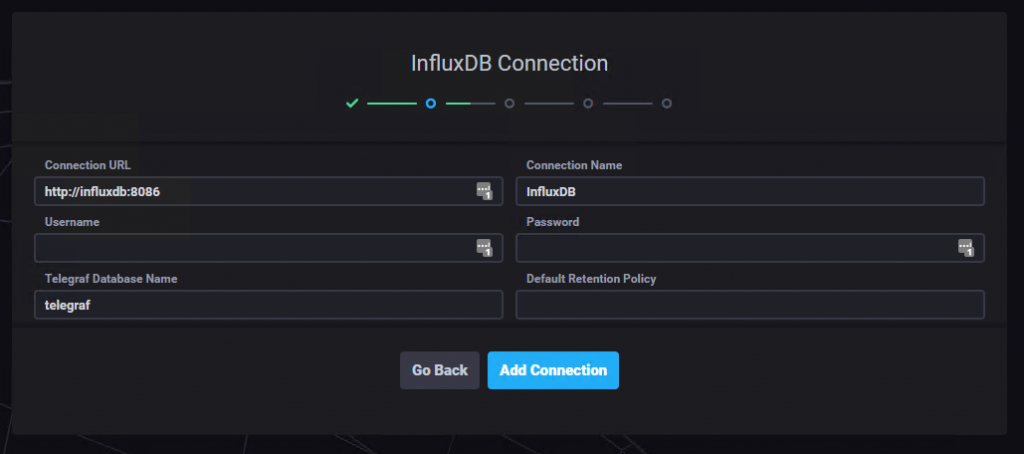
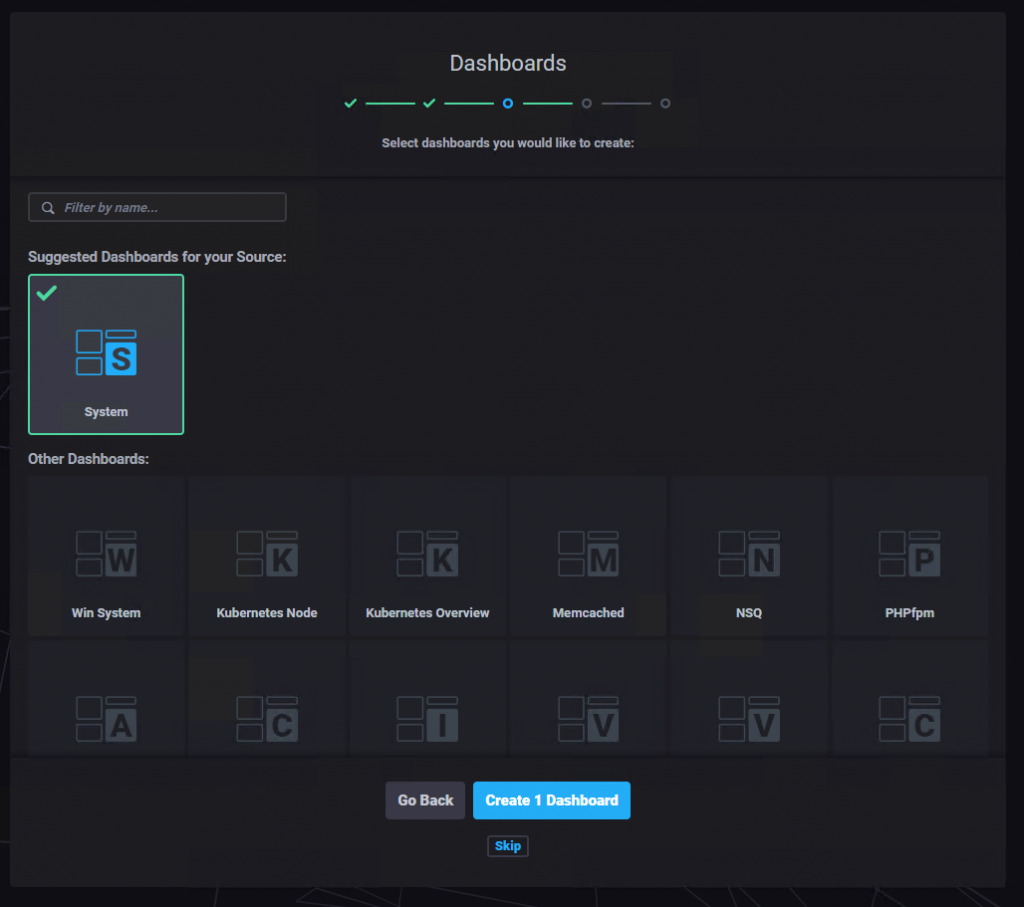
As you could see from the screenshots, super easy, couple of seconds max.
Now it’s time to begin creating the actual dashboards with the data that we need, this is the part where using influxDB pays off if you want to do something custom.
Let’s get to the Explore tab to start playing around:
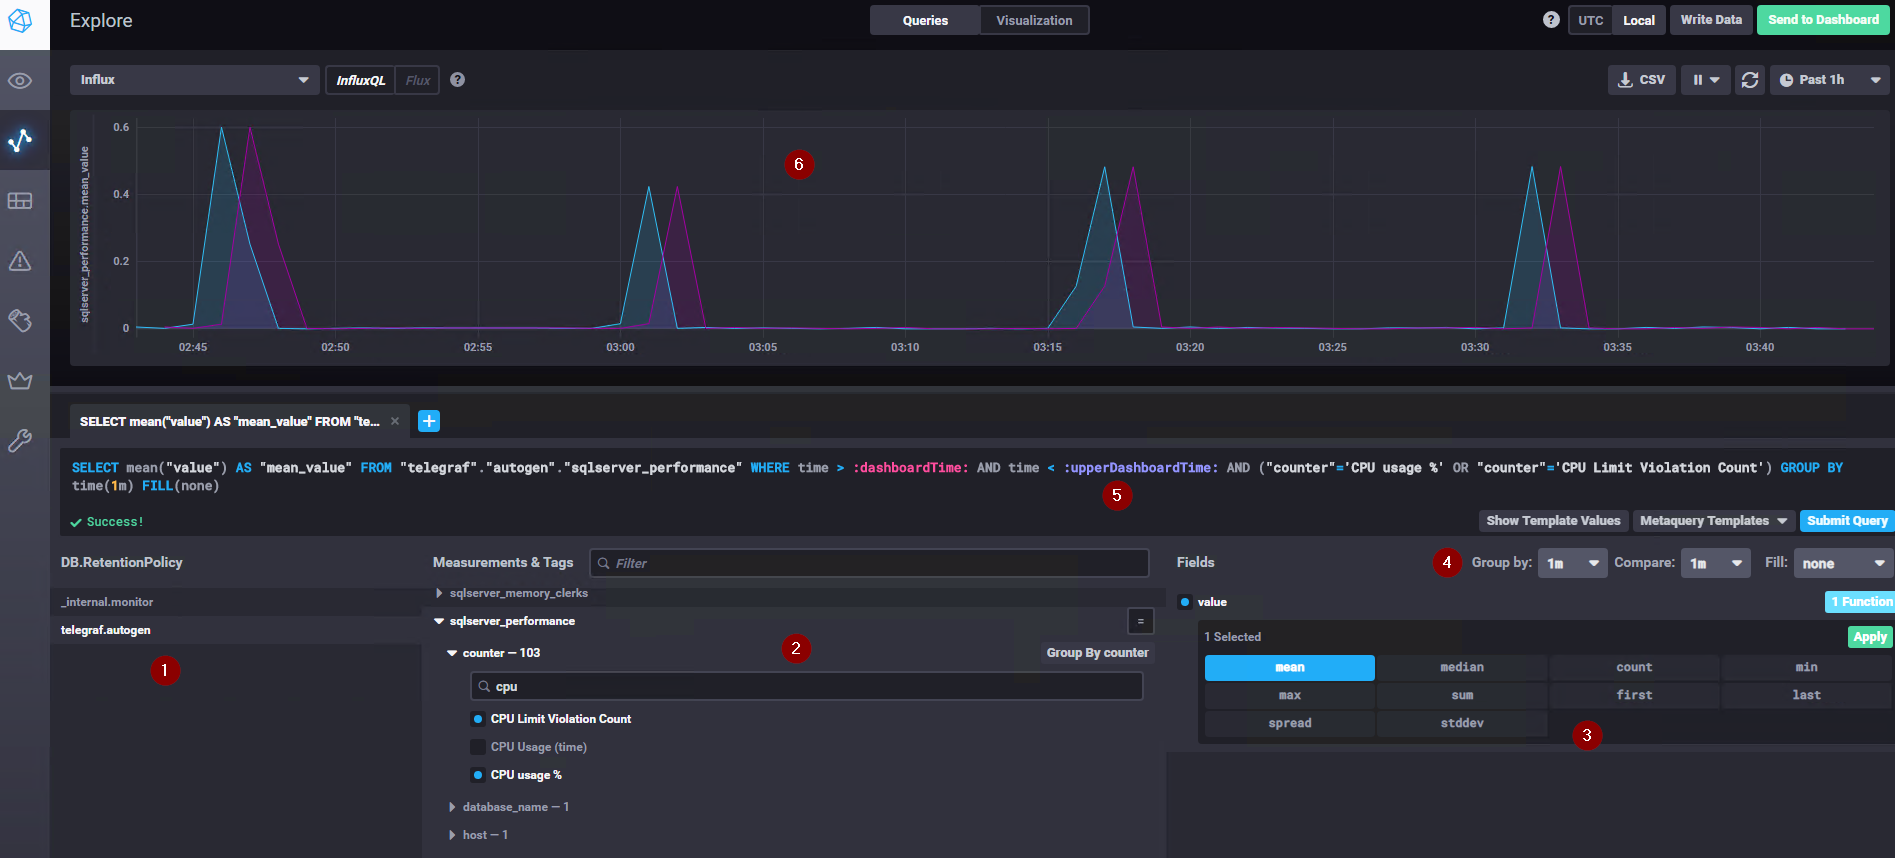
- The list of databases, if telegraf was configured correctly you’ll see its database here
- This is the nice part, you can use this window to explore the schemas/tables/data of your telegraf DB.
It’s very intuitive to just go into the type of data that you are searching for; in the example I’ve searched for CPU counters in the sqlserver_performance table created by telegraf - This defines the values to get and the aggregation(s), more than one aggregation is selectable
- The time grouping, which can be automatic or a specific value can be selected. It’s possibile to show a value in time to compare the current value to and decide what to show whenever there are no values coming from the query
- The query auto-generated by the GUI is still modifiable, i.e. you can create it here and copy paste it wherever necessary
- The output graph for your query; the time interval shown and the refresh time can be configured in the upper right corner
Right in the center, on top of the page, there is a switch to move from the query pane to the visualization pane; of course by clicking it you’ll get to the graph customization options:
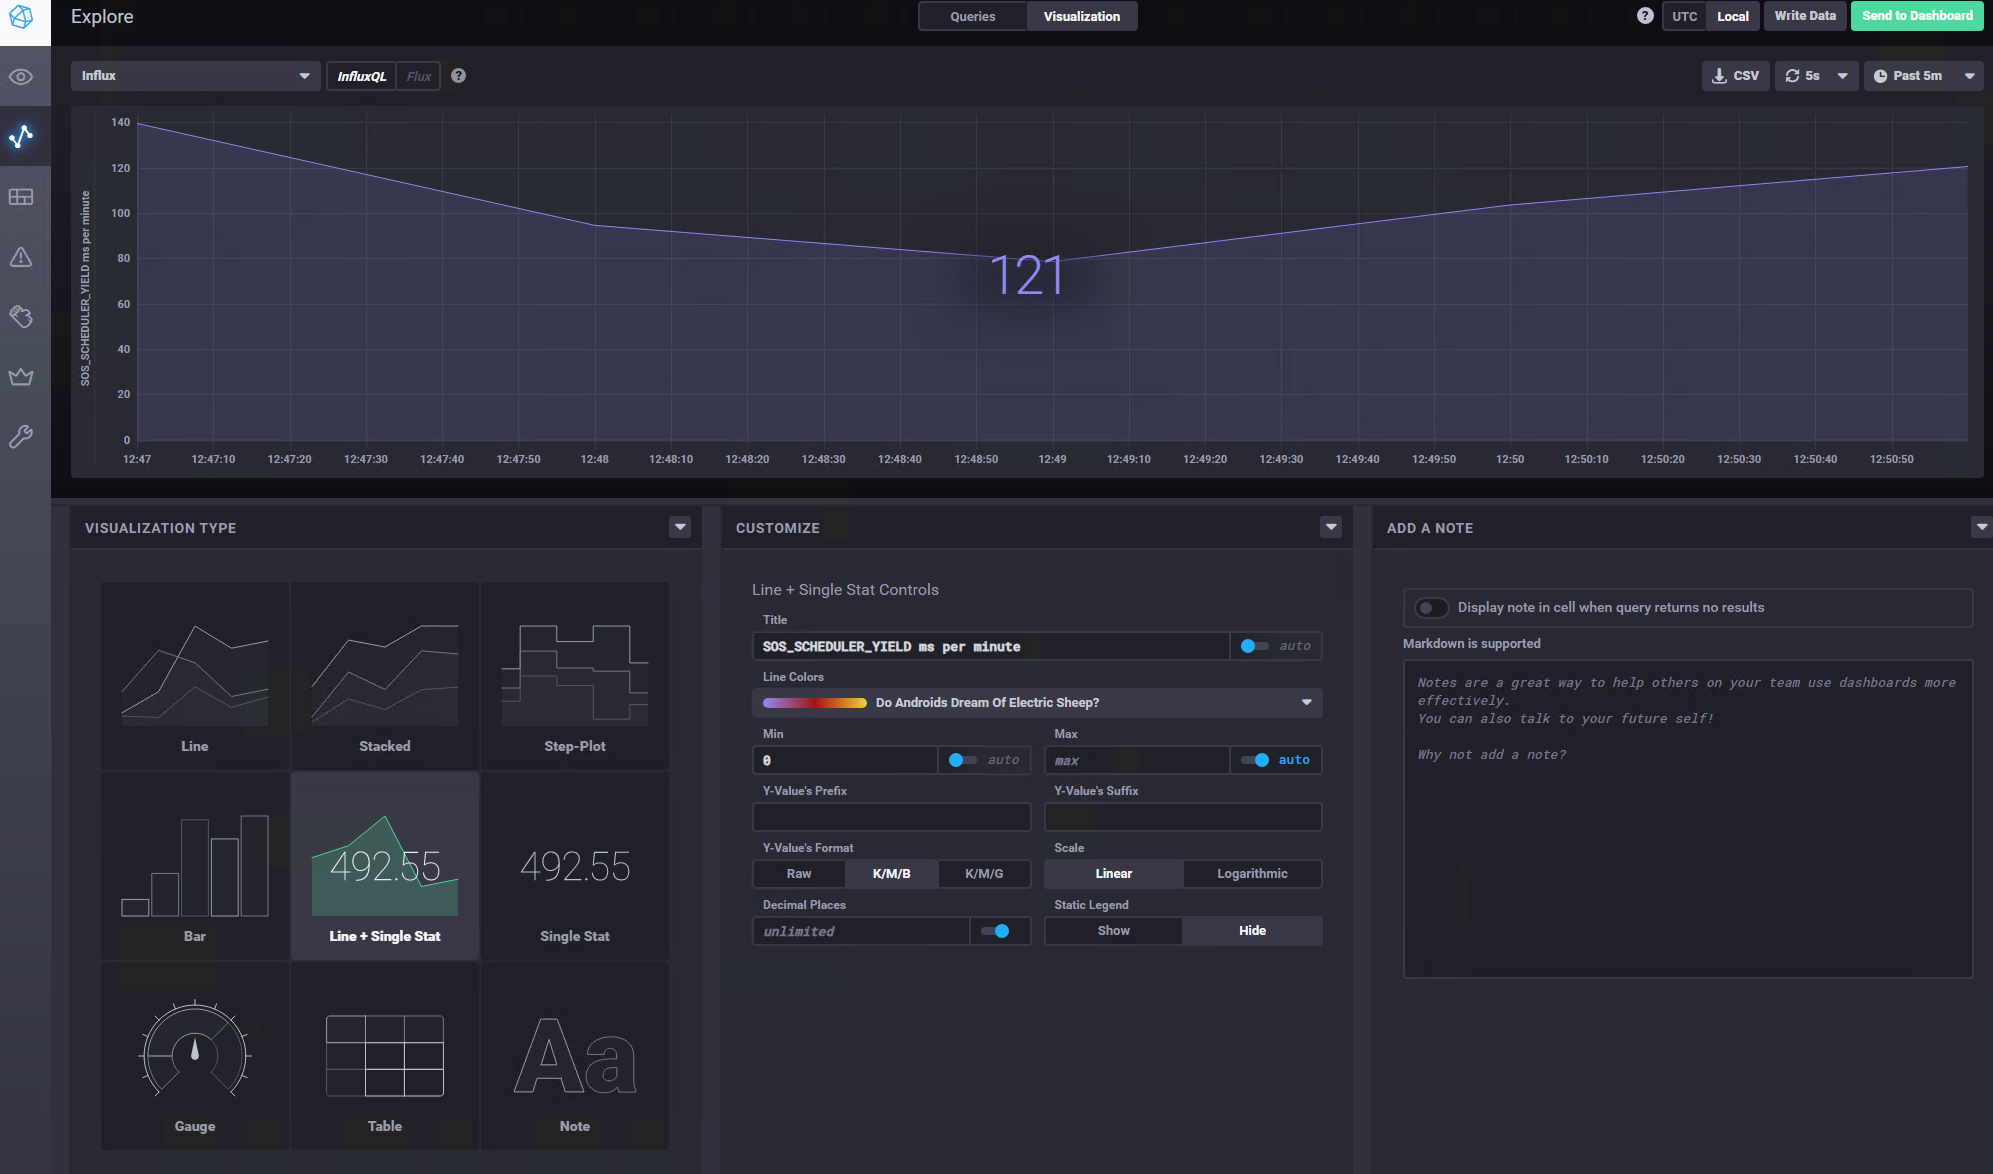
The preview of what will be showed is live and it continues to fetch the streaming data from your instances.
Creating a dashboard is basically just as easy; by going into dashboards -> Create new dashboard the same GUI appears to populate the tiles that compose your dashboard. i.e Explore is for experimenting of what you want to get and then save it on your dashboards
Kapacitor
Adding Hooks to Kapacitor
In the configuration menu of Chronograf, Kapacitor can be configured via a GUI, a lot of endpoints can be added for Kapacitor to send the alerts to
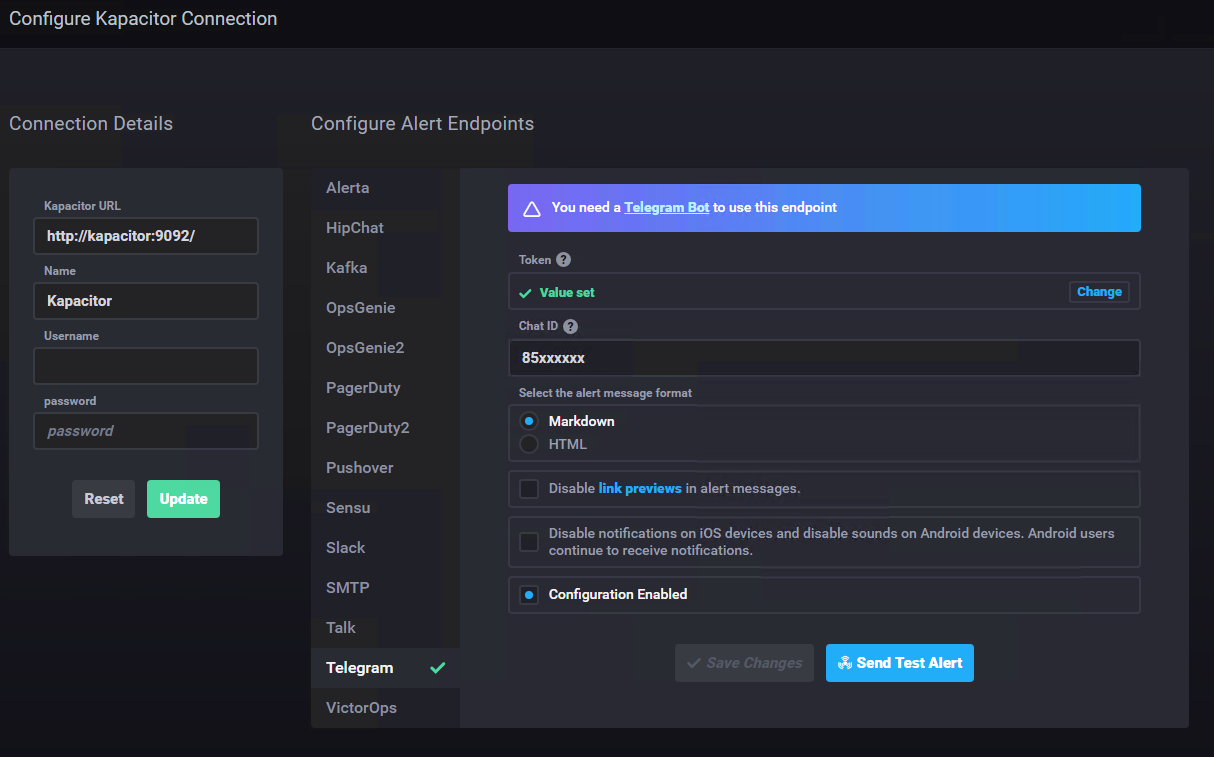
For my demo I’ve enabled the Telegram endpoint, now I have a telegram bot that writes me whenever an alert fire.
Configuring Alerts
Yep, makes no sense to configure an endpoint if there are no alerts configured, right?
That’s super easy, we just need to get to the Alerting menu and build a new alert rule:
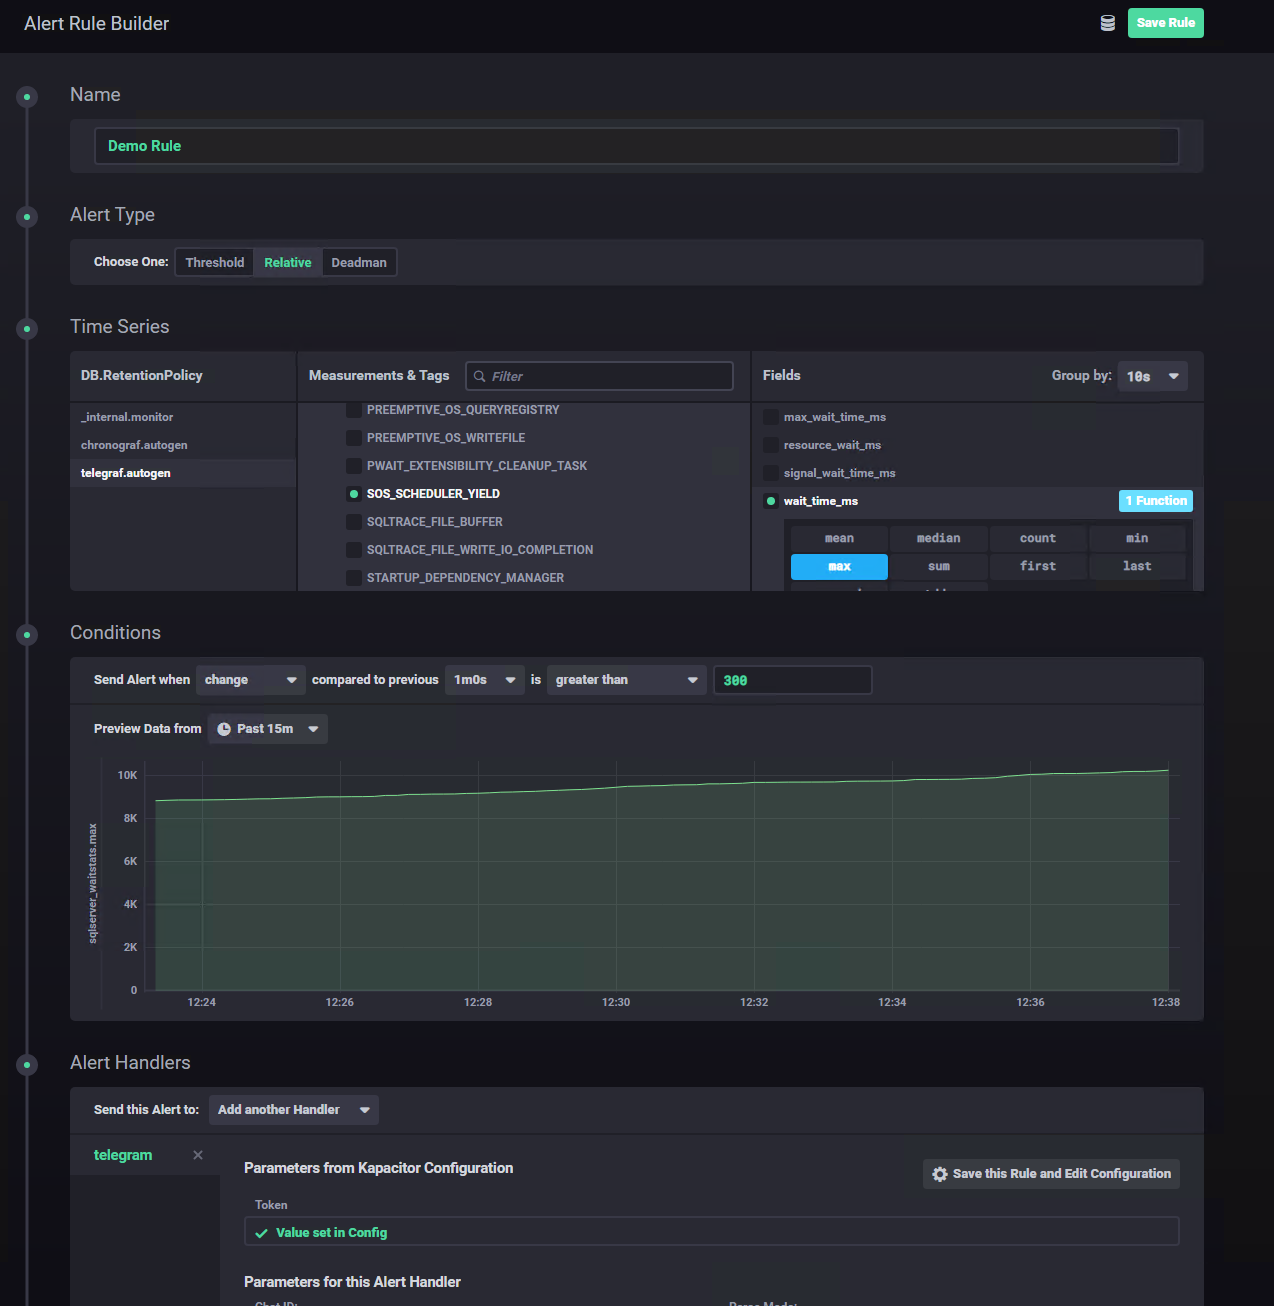
In the example, I’ve created a warning for when the value of the waitstat SOS_SCHEDULER_YIELD changes by over 300ms from one minute to another (e.g. from 100ms/minute to 400ms/minute). Does it makes sense? You should know, I’m just showing an example here, not a complete solution 🙂
From the interface it’s easy to see that absolute, relative and even deadman (i.e. something is not responding anymore) alerts.
You can send the alert to any of the configured endpoints and to some standard endpoints like a POST, a tcp request, logging or even executing your own custom command.
Conclusion
For the “no budget DBA/sysadmin” or for someone that needs a certain level of personalization which vendor products cannot provide (e.g. monitoring multiple heterogeneous and custom system from a centralized location with a centralized capacity) this is a low cost, low resource solution which can be deployed in an existing container server
Guess this works on influx < 2.0, on newer version there is 401 error connecting to influxdb instance
Indeed, this article was written when InfluxDB 2.0 didn’t exist yet