
In this container-centric era to complement my SQL Server instance on docker (previous articles here) I’ve looked over containerized monitoring solutions, and chose Grafana as my first candidate; spoiler: everything is simple once you’ve figured out how this stuff works, which can be not trivial for a Windows Guy (like me)
Note: I’m focusing on SQL Server as always but as you will se everything is applicable in the same exact way to any database technology supported by telegraf.
“Infrastructure” Overview
Elements
Grafana: Is an open source analytics and monitoring solution for every database. Grafana allows you to query, visualize, alert on and understand your metrics no matter where they are stored. Create, explore, and share dashboards with your team and foster a data driven culture.
InfluxDB is a programmable and performant time series database, with a common API across OSS, cloud and Enterprise offerings.
Telegraf is a plugin-driven server agent for collecting and reporting metrics, Telegraf collects and sends all kinds of data from databases, systems and IoT sensors.
Overview
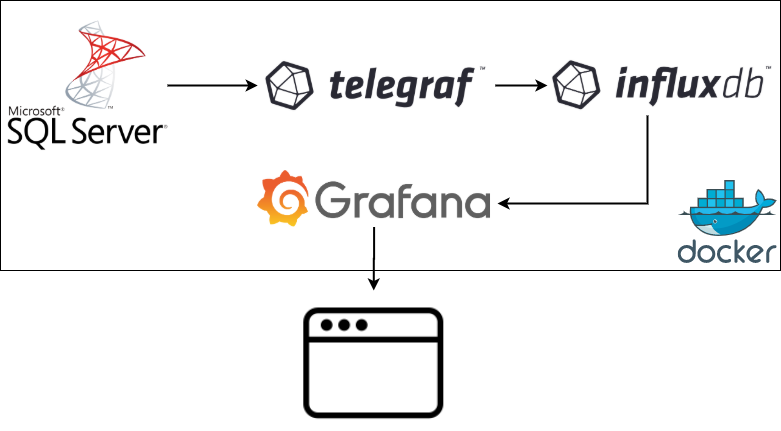
Ok, here is the deal: Telegraf connects to your SQL Server instance(s) and starts reading from the DMVs, it doesn’t require or create any additional object; how stuff is collected is defined by Telegraf, which is a component for InfluxDB that already has more than 170 plugins to ingest data from the most disparate sources, including SQL Server of course.
The SQL Server Telegraf Plugin is defined here; we’ll push the streamed data to InfluxDB, a Time Series Database, which is then queried by Grafana to create a monitoring dashboard.
SQL Server could be queried directly by Grafana, but I’m using Telegraf + InfluxDB because:
- The monitoring components of the instance are containerized, any change won’t impact the SQL Instance
- The same containers can be used to monitor multiple SQL Instances (or one of the other 170+ components that telegraf can read from)
- There are some ready-to-go dashboards on the Grafana portal, hence I won’t have to reinvent the wheel, just customize it
- I never tried this approach, my joy is in experimenting
Al alternative Solution would have been to use the firstresponderskit (as in this PowerBI report) in order to have the historic DMV data saved on the instance itself and generate custom queries to fetch from them and create Grafana’s graphs and indicators; this would eliminate the InfluxDB containers but it means that Grafana would hit the instance with “complex” queries every few seconds, as opposed to pushing raw DMV data and having InfluxDB and Grafana do the rest.
How to do it
I’ll be monitoring my SQL Server 2019 instance, created in my previous articles; if you’re starting from scratch here are the docker commands:
docker pull mcr.microsoft.com/mssql/server:2019-latest
docker network create localnet

docker run `
-v sqlvolume:/var/opt/mssql `
-v D:\SQL:/sql `
-i `
--name sql2019 `
--net localnet `
-p 1433:1433 `
-e "ACCEPT_EULA=Y" `
-e "SA_PASSWORD=This is a password,ok?" `
-e MSSQL_AGENT_ENABLED=True `
-d mcr.microsoft.com/mssql/server:2019-latest

docker start sql2019
There are a couple of new rows in the execution code since last time, specifically:
- docker network create localnet
Since everything will run in docker containers, with this command I’ve created an internal network where I’ll put all the containers used, in this way there won’t be any issues with network, IPs, etc.. - -e MSSQL_AGENT_ENABLED=True
This environmental flag tells the container to enable the SQL Agent for the containerized SQL instance
The agent doesn’t need to be enabled for this demo, but since I needed it, here he is, enabling the agent on a container is this easy.
As detailed in the Telegraf Github page, I’ve then created a dedicated login for telegraf which has only the minimum required grants:
USE master;
GO
CREATE LOGIN [telegraf] WITH PASSWORD = N'mystrongpassword';
GO
GRANT VIEW SERVER STATE TO [telegraf];
GO
GRANT VIEW ANY DEFINITION TO [telegraf];
GO
Pull Grafana
Step 1, is to download and run the Grafana container
I’m creating a docker volume too in order to persist the data for the grafana instance:
docker volume create grafana-storage
docker run -d -p 3000:3000 --name=grafana --net localnet -v grafana-storage:/var/lib/grafana grafana/grafana
I’m not explicitly pulling the image from Docker Hub, but I’m relying to the auto-pull that happens when you’re trying to run a container for which you don’t have any image; note that it’s created directly on my shiny localnet
Pull InfluxDB
docker run -p 8086:8086 --name=influxdb --net localnet -v D:\SQL\Influx:/var/lib/influxdb influxdb
Note that I’m mounting /var/liv/influxdb to my local folder D:\SQL\Influx in order to persist data and have the files directly on my filesystem.
I’ve persisted the files on my filesystem as opposet to a Docker volume because if things were perfect in demos you wouldn’t pay for consultants 🙂
Pull and configure Telegraf
Ok, until now nothing new, now we have to start configuring stuff,
Telegraf has a configuration file to be filled in order to connect to influxDB and your input datasource of choice (in our case, SQL Server on another container). With the command below, you’ll create a sample configuration file to be edited with your editor of choice:
docker run --rm telegraf --net localnet telegraf config > telegraf.conf
It creates the telegraf.conf file in the current folder, now it’s time to edit it.
The output influxDB address needs to be configured, in my case I can simply use the name of the container, which in my case is conveniently influxdb
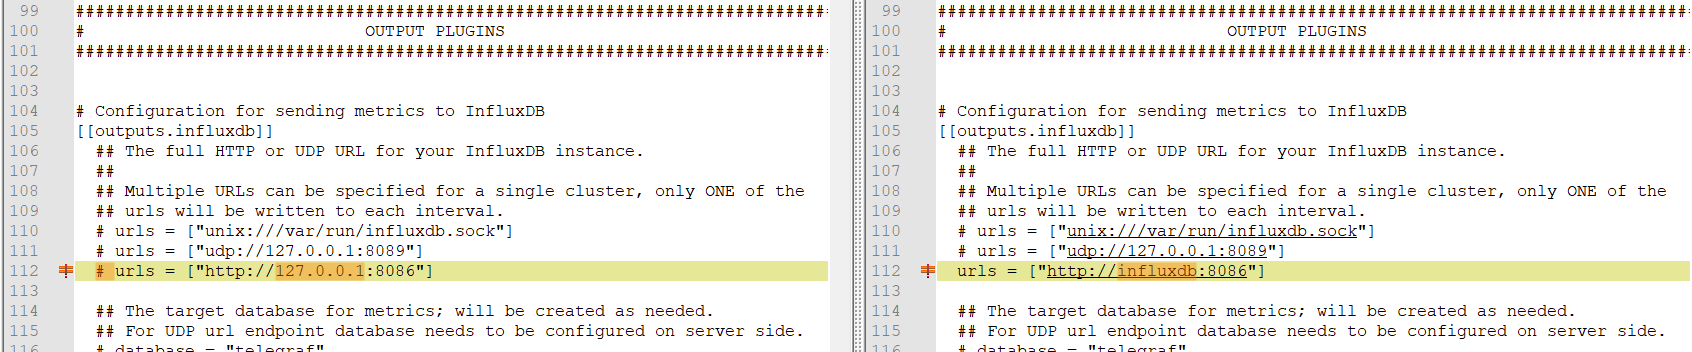
Note that the comment symbol “#” has been removed in order to apply the configuration value to Telegraf.
Next, the connection to the SQL Server, as before I can use the name of my container in the server address:
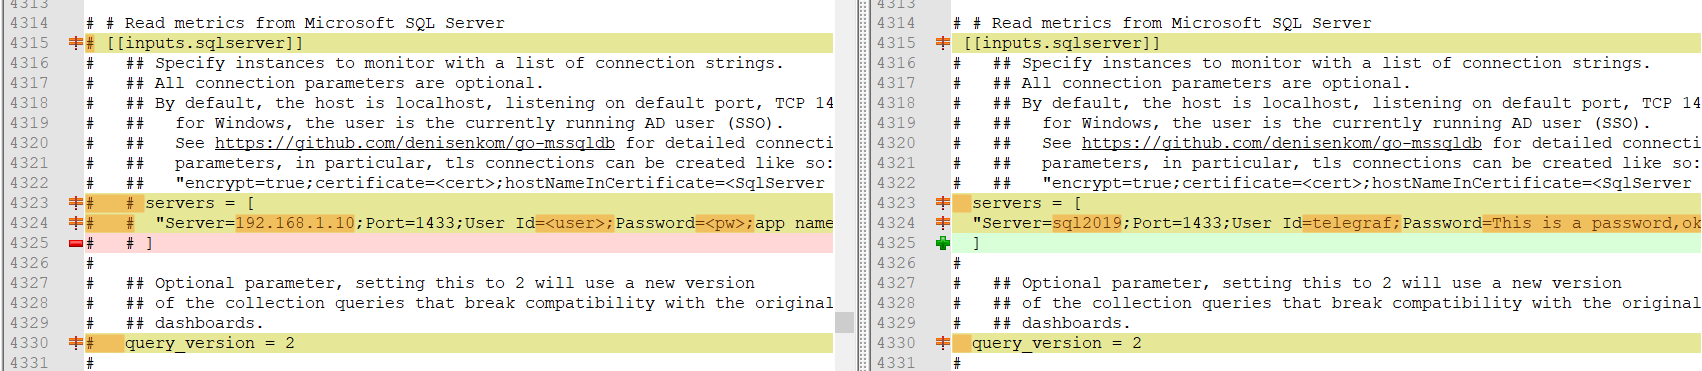
Note again that I’ve removed the hash/pound symbol from the lines, this is the part that created me the most issues :!
I’ve saved my edited file in D:\SQL\telegraf.conf, now it’s time to finally start up the telegraf container by mounting the configured file
docker run -v D:\SQL\telegraf.conf:/etc/telegraf/telegraf.conf:ro --name=telegraf --net localnet telegraf
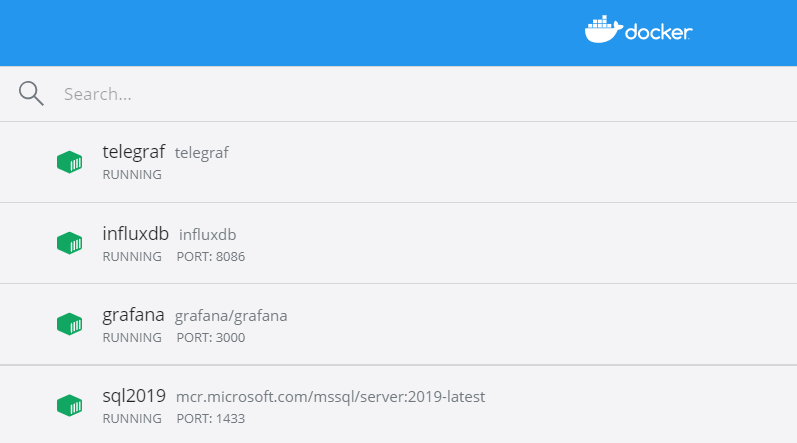
At this point, 4 containers will be up and running in docker, here is what you’ll see from Docker Hub:
Configuring Grafana
Finally, off to Grafana!
Opening the browser and pointing to localhost port 3000, shows the Grafana login window:

Default username and password are admin/admin, classic, you can change it right away.
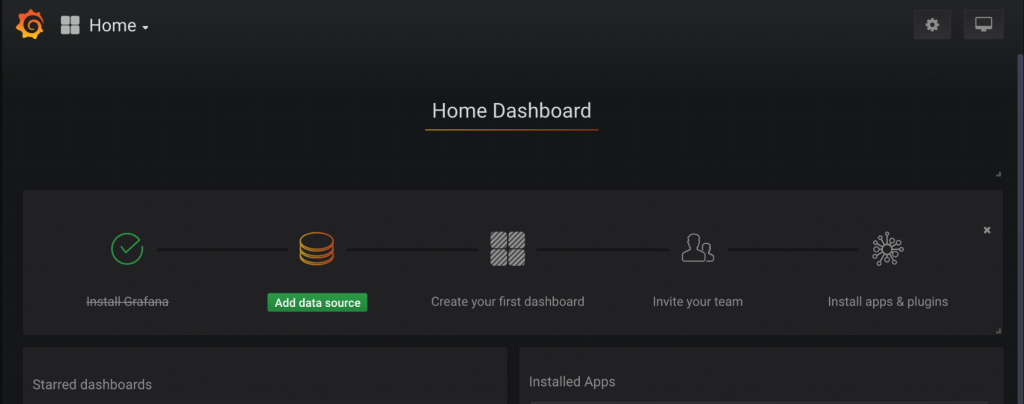
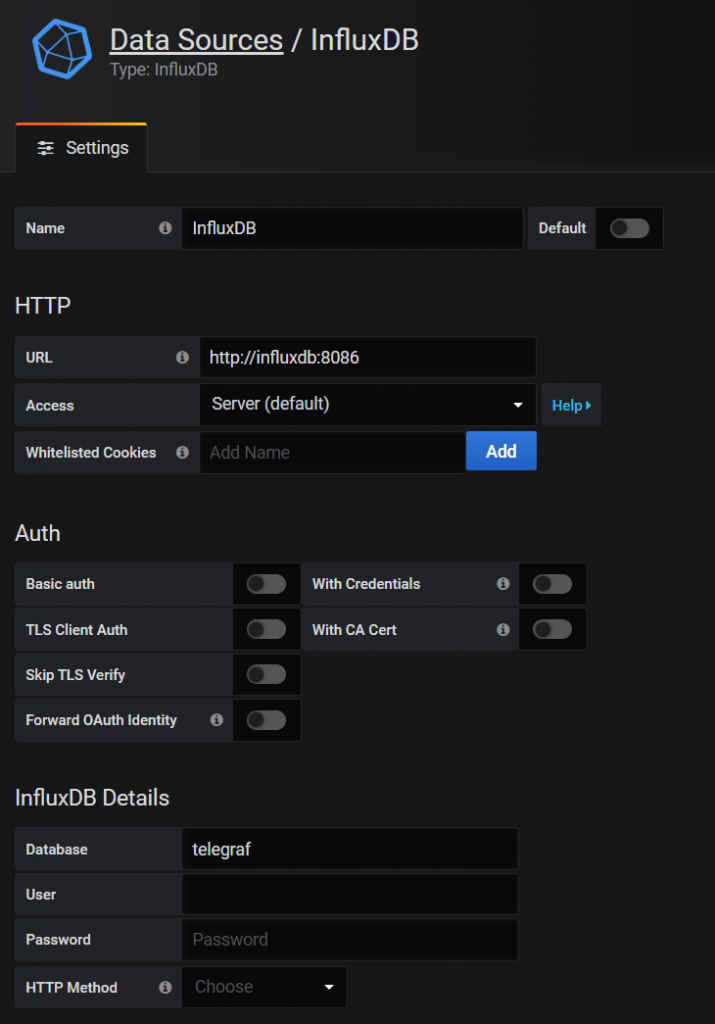
The home page will show what are the next steps, we only care about adding a data source at the moment, so let’s click there and select InfluxDB, the configuration is pretty straightforward luckily:
That’s it! Now it’s possible to create any dashboard querying InfluxDB.
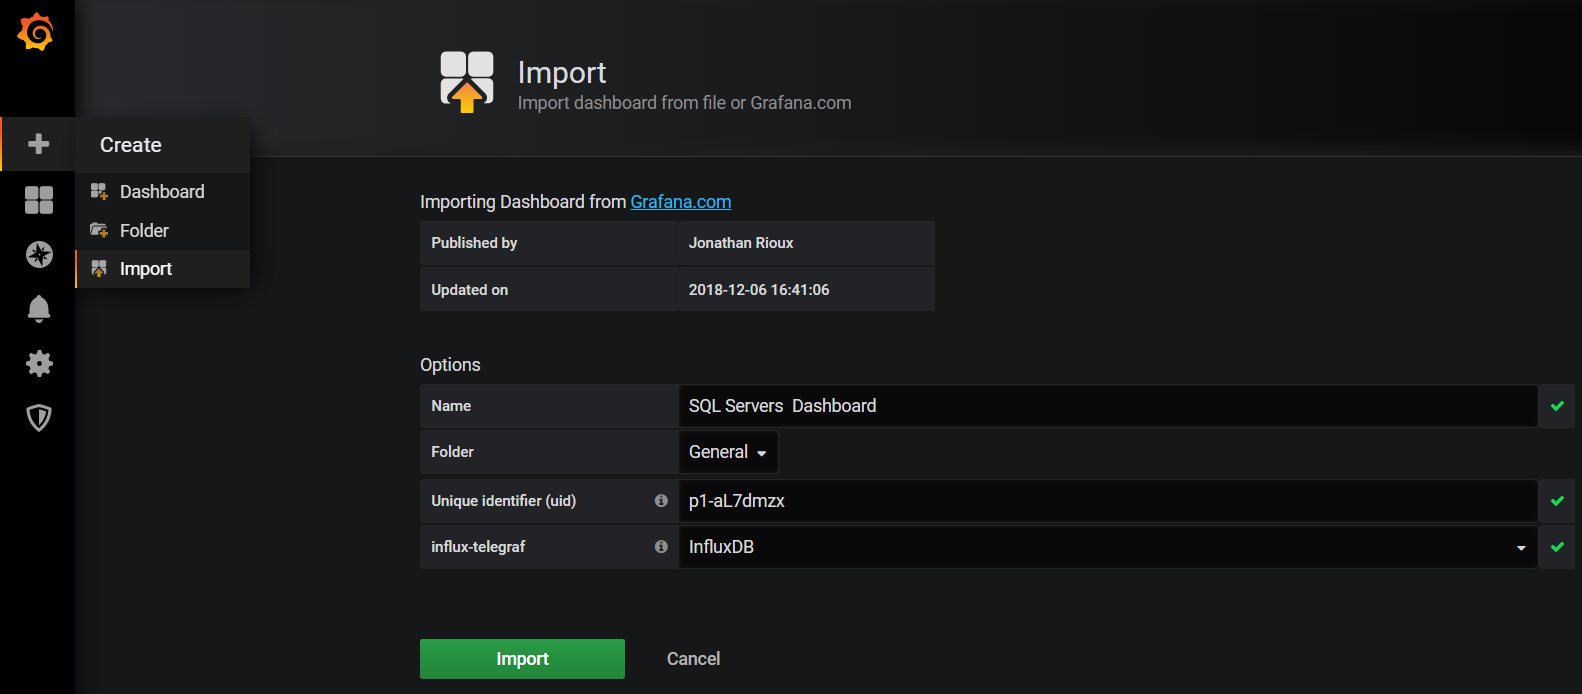
The fastest thing possible is to import a premade Dashboard from the Grafana repository and start from there; I’ll be using this dashboard by Jonathan Rioux
Importing the Dashboard is super easy, it’s just a matter of copying the dashboard ID from the page linked above and pasting it in the “Import” menu (Plus sign/Create -> Import); other options are to paste/upload the definition JSON directly:
Done!
Using Grafana
If everything was done correctly, by opening the newly imported dashboards, after a few seconds data should start to come in and your dashboard will be populated with all kinds of indicators
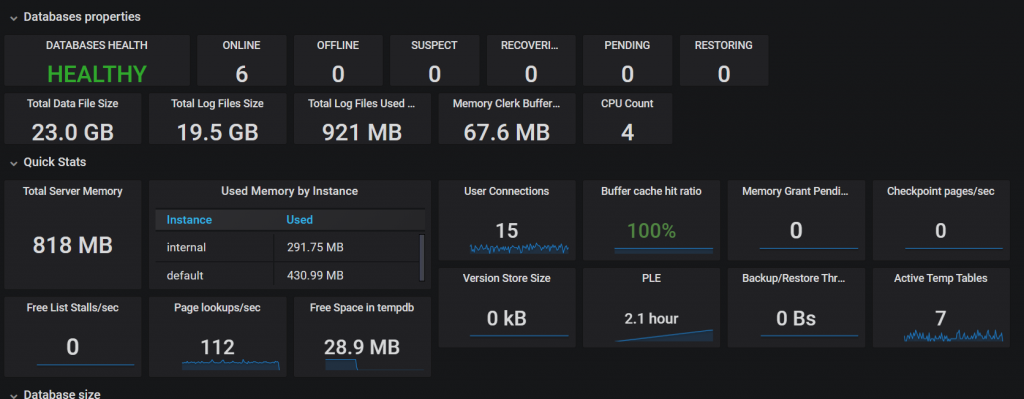
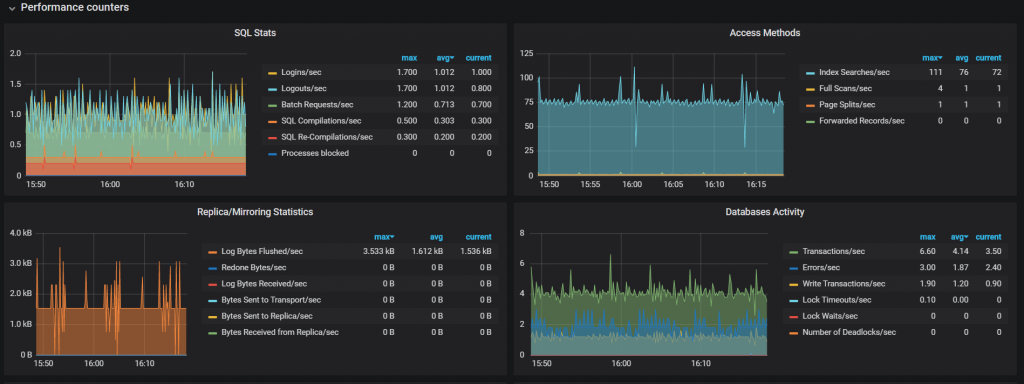
Each panel can be moved/edited/removed and new panels can be created.
Querying InfluxDB is semi-automated, since fields can be selected via a dropdown menu in the query editor:
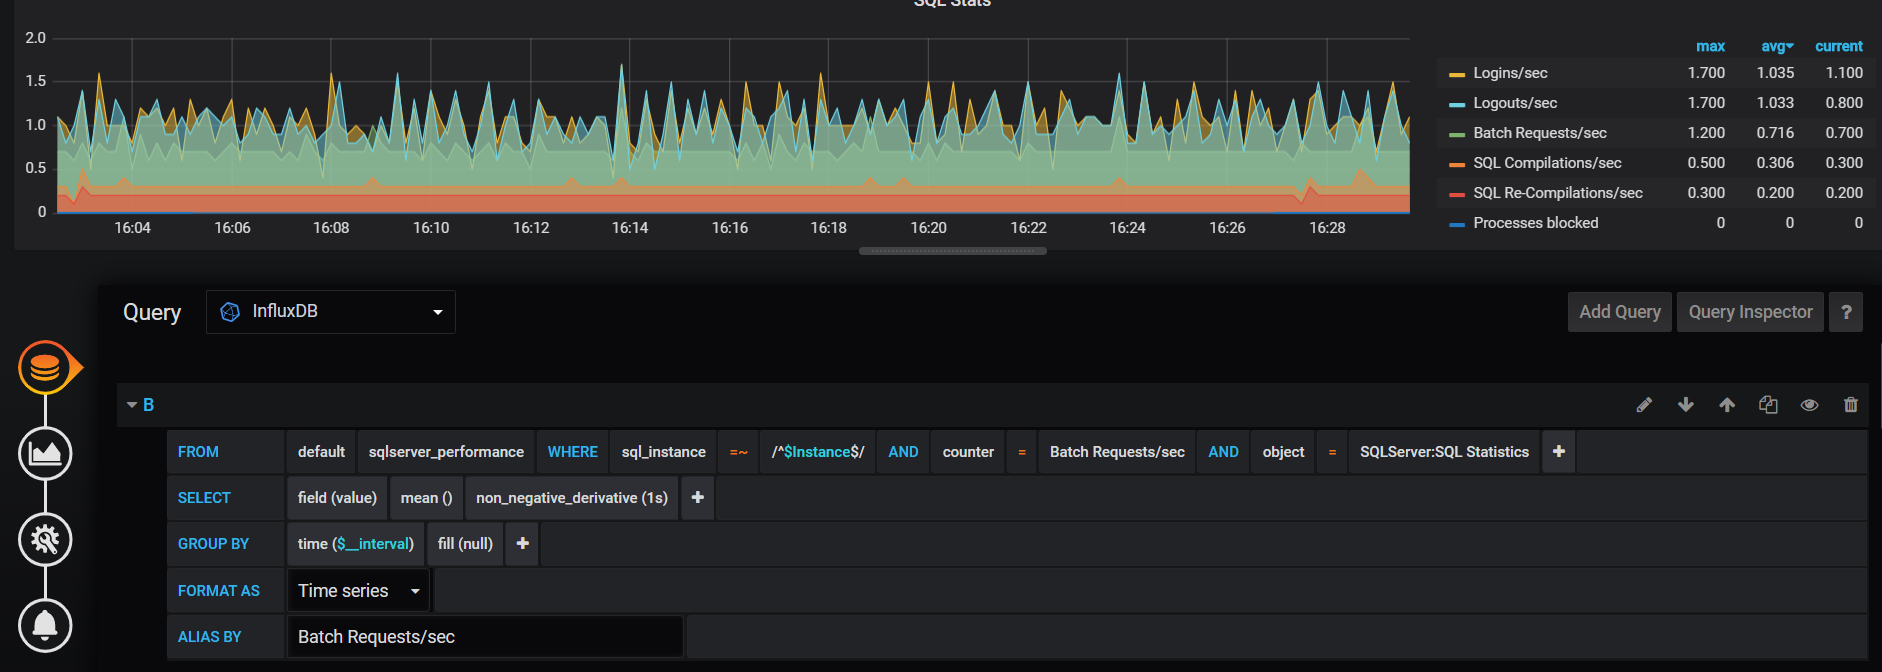
From now on, the limit is your imagination only!
Hi Emanuele,
Can we have custom DMV’s run every 5 seconds and capture results in InfluxDB table and build metrics out of this table ?
Thanks,
Ranjith
Hey Ranjith,
you can, but not using Telegraf, since it will give you only the metrics that are coded in the package
You’ll have to manually import it using the SQL Package in Flux and query the DMV from there, this article may help you: https://v2.docs.influxdata.com/v2.0/query-data/flux/sql/#query-a-sql-data-source
[…] Garafana + InfluxDB + Telegraf – You can see how to install it in Emanuele Meazzo’s Post which does it […]
I get an error with command :
docker run –rm telegraf –net localnet telegraf config > telegraf.conf
Error is :
2023/06/19 21:10:42 E! flag provided but not defined: -net
I’m not a docker expert …
This is an old article, probably the container has changed and doesn’t support that flag anymore; unfortunately I’m not playing with this toy these days so I don’t have further info
Hi, I’m having trouble configuring telegraf when I run the command ( docker run -v D:\SQL\telegraf.conf:/etc/telegraf/telegraf.conf:ro –name=telegraf –net localnet telegraf ) it return me this error.
Ciao Anderson,
in my example I mounted the SQL volume to the D:\SQL folder on my machine, be sure to have the same folder structure or change the parameters appropriately