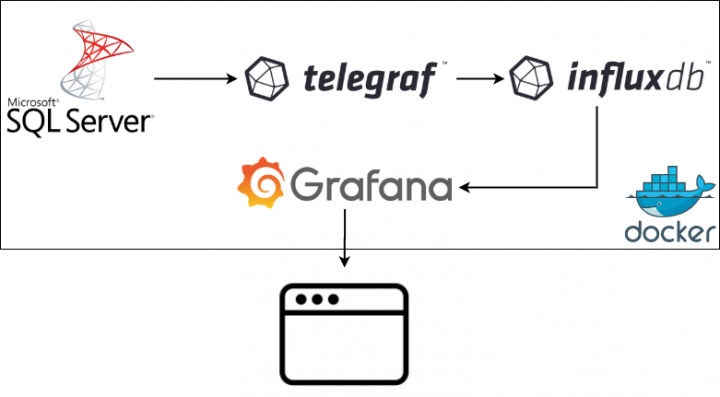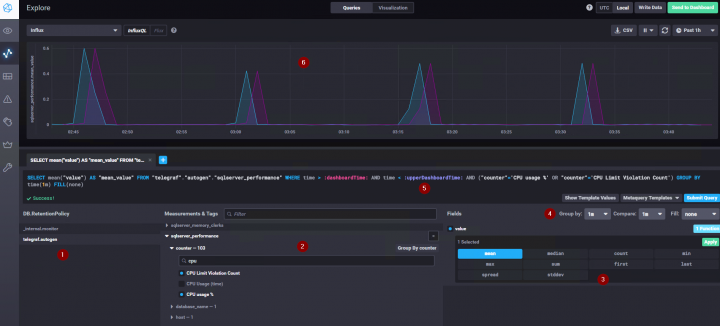
Oh boy, this is a spinoff of my previous post on “How To Use Grafana (On Docker) To Monitor Your Sql Server (Eventually On Docker Too) – Feat. Influxdb And Telegraf” , which is a nice solution, but I wanted to create something that’s even more easy to deploy, more configurable and without the need of actually knowing influxSQL or learning the influxDB Telegraf schema; for these...
How to use Grafana (on docker) to monitor your SQL Server (eventually on docker too) – feat. InfluxDB and Telegraf
In this container-centric era to complement my SQL Server instance on docker (previous articles here) I’ve looked over containerized monitoring solutions, and chose Grafana as my first candidate; spoiler: everything is simple once you’ve figured out how this stuff works, which can be not trivial for a Windows Guy (like me) Note: I’m focusing on SQL Server as always but as you...
Watch the Replay of my Session @ GroupBy
Slides and materials for my session “How to use PowerBI as a Monitoring Tool” @ GroupBy.org
Good news everybody!As you may know if you follow me on Linkedin , I’ve been selected as one of the GroupBy Speakers for the last GroupBy session for 2019! My session will be: How to use PowerBI as a free monitoring tool (including 5 free reports for SQL Server) (session abstract here) I’ve already published the session slides and materials for you to follow along, you can find them...